1,758 tables · 294 datasets · 140 sources · 521 GB

Brazil in data, portraits of the official numbers

The portrait the Brazilian State already has of itself: 1,758 official tables — from birth to death, from company registry to ballot box, from federal budget to river flow — cross-referenced to show what none of them reveals alone.

Written in Portuguese first, with full English translations of all 43 essays. Start with the 43 themes or explore the platforms and maps below.

Platforms (12)

Dashboards, maps and networks to explore the whole data, not just the slice an analysis used. The platforms themselves are in Portuguese.
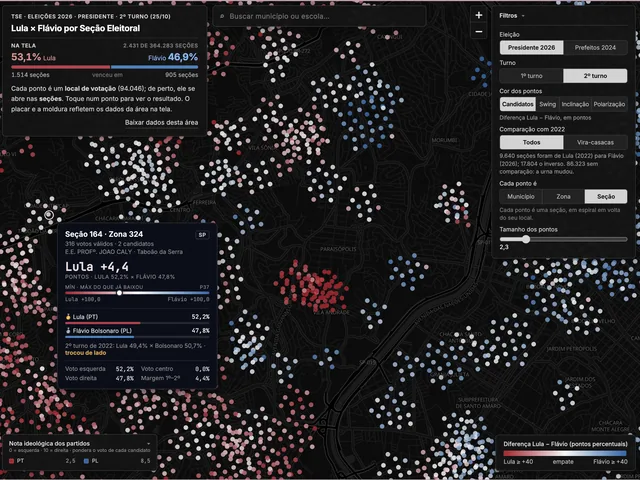
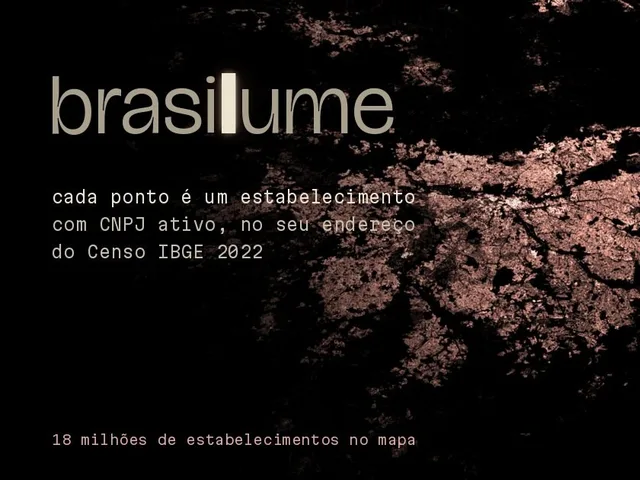
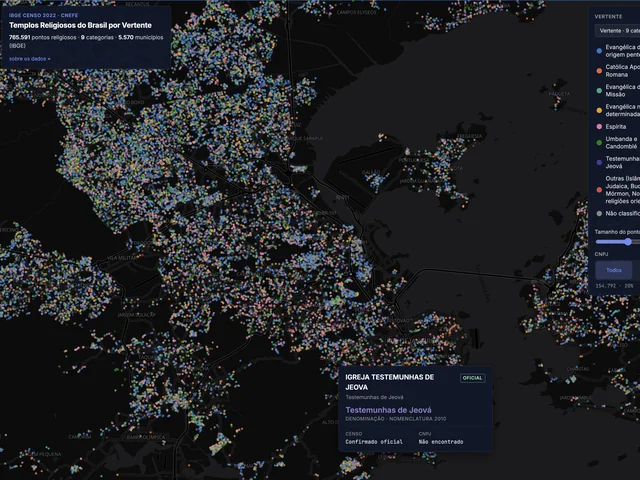
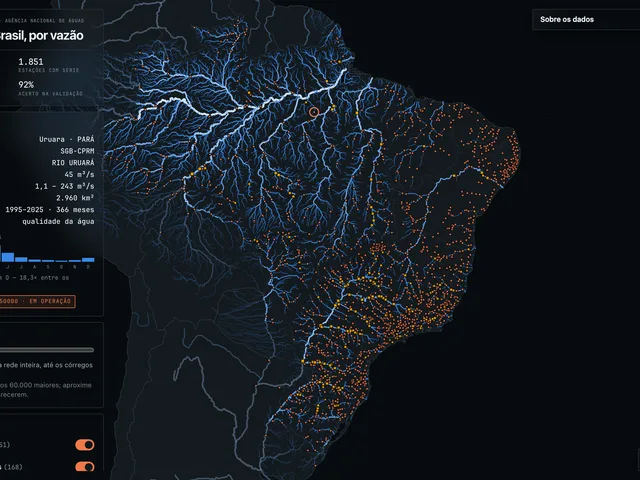
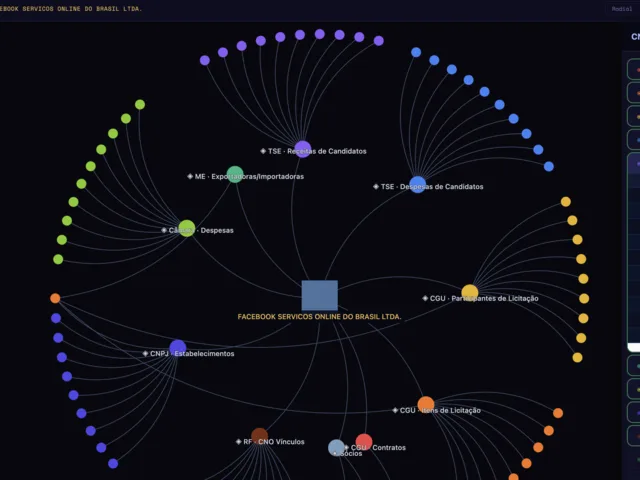
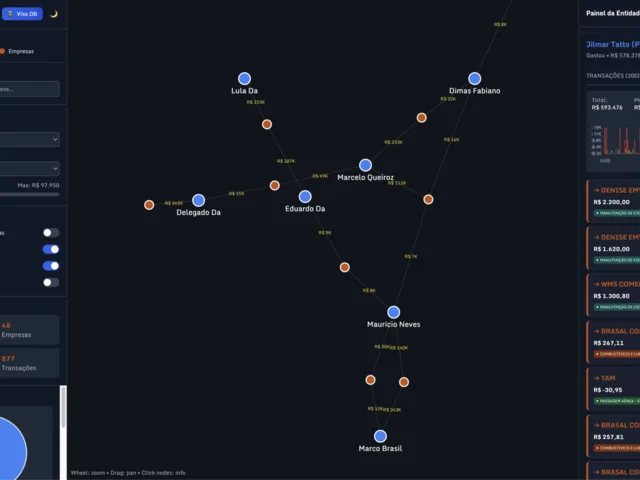
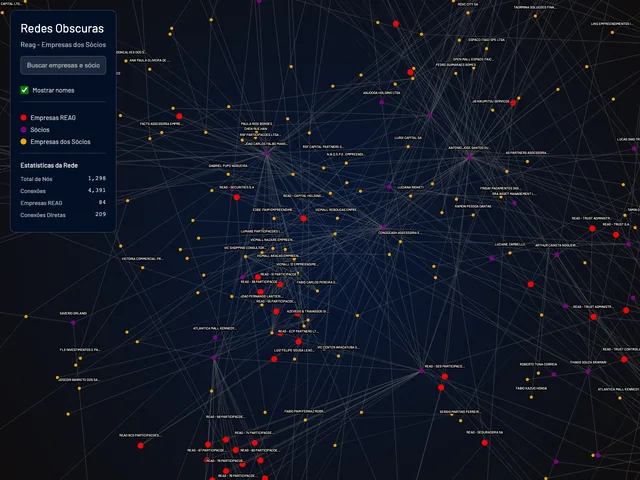
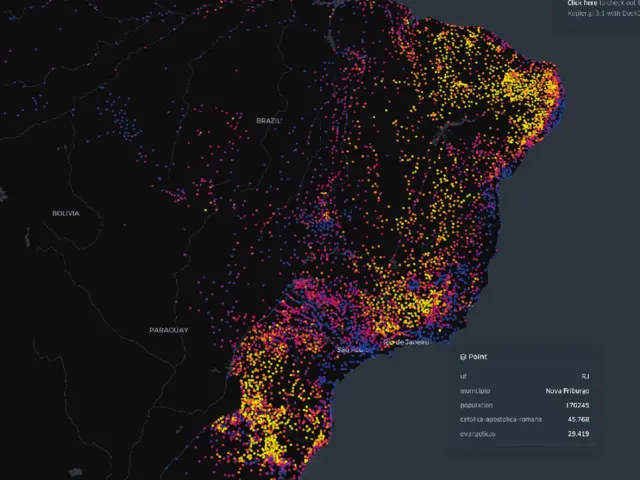
2026 runoff across 94,000 polling places, one dot per place, from Lula (red) to Flávio (blue)Lula × Flávio, polling station by polling station São Paulo seen from above at night, drawn only in points of light, one per establishmentbrasilume — every dot is a company registration (CNPJ) 765 thousand places of worship from the 2022 Census, each coloured by religious denominationBrazil's places of worship by denomination 462 thousand river reaches, coloured by streamflow — and by actual trend, not averageAre Brazil's rivers drying up? Companies and people cross-referenced by CNPJ across federal databases, dataset by datasetDatative — graph of CNPJs across federal databases Deputies and companies linked by parliamentary allowance spending, as a networkViso — network of deputies and companies 1,298 nodes, 4,391 connections: the ownership network behind ReagFinCrime — Obscure Networks Catholics and evangelicals in every municipality, 2010 and 2022 Censuses side by sideReligious profile of Brazilian municipalities See the 12 platforms

DataViz (9)

The same data, seen on the map: nine cartographic explorations at the DataViz.
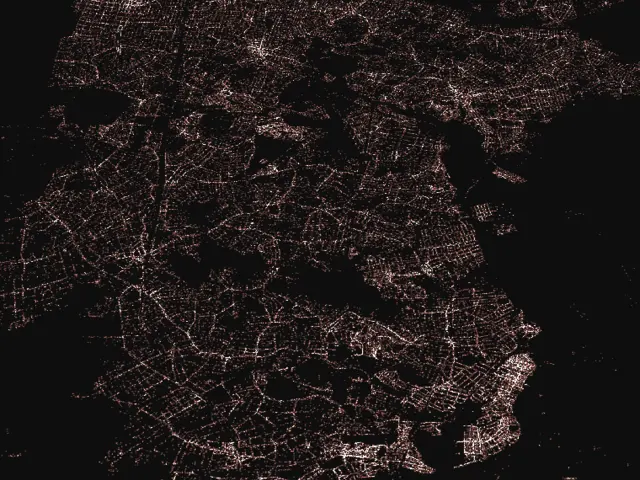
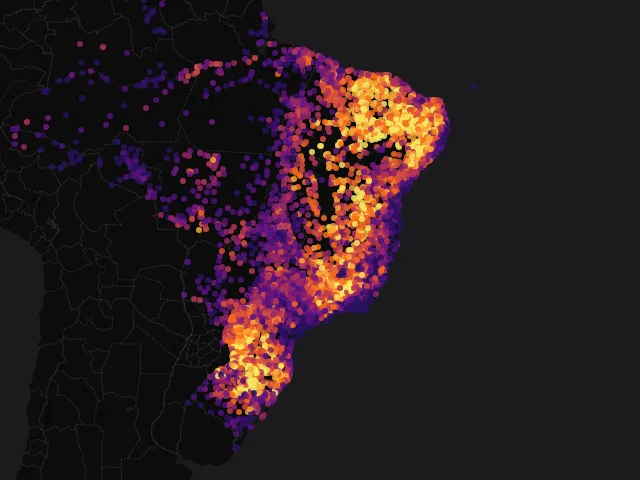
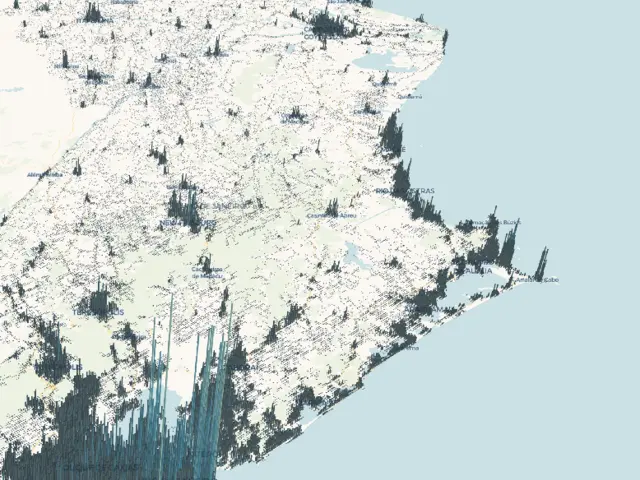
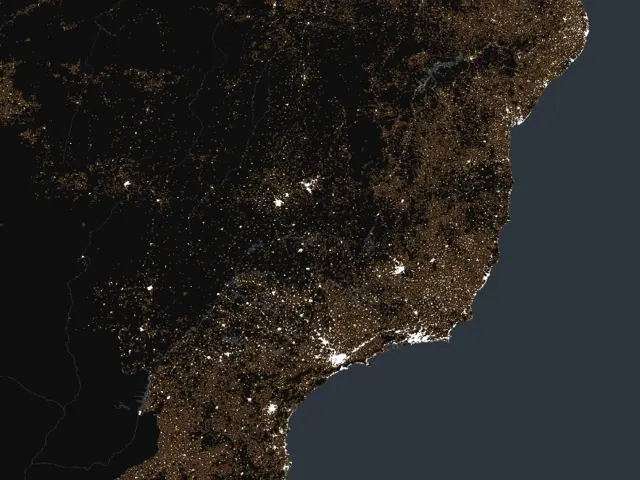
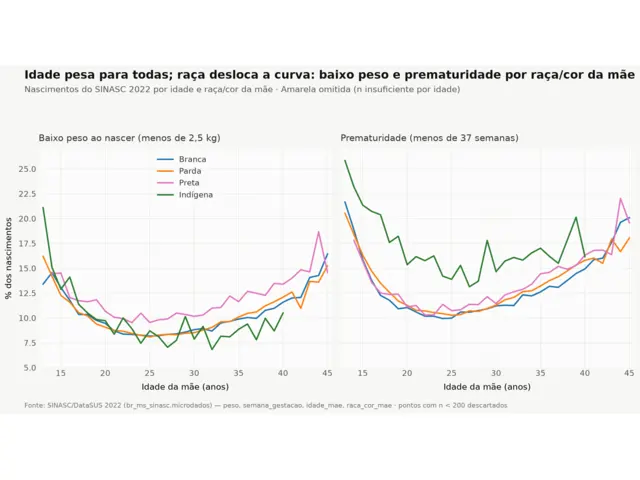
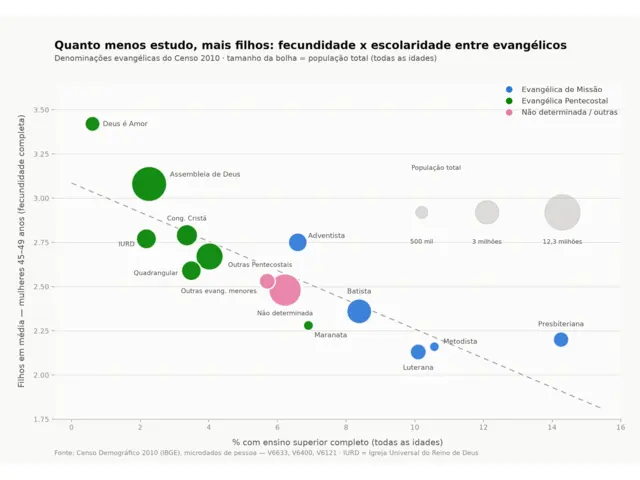
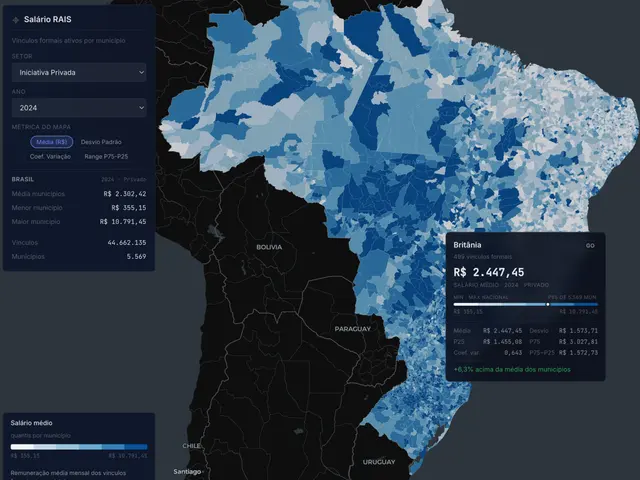
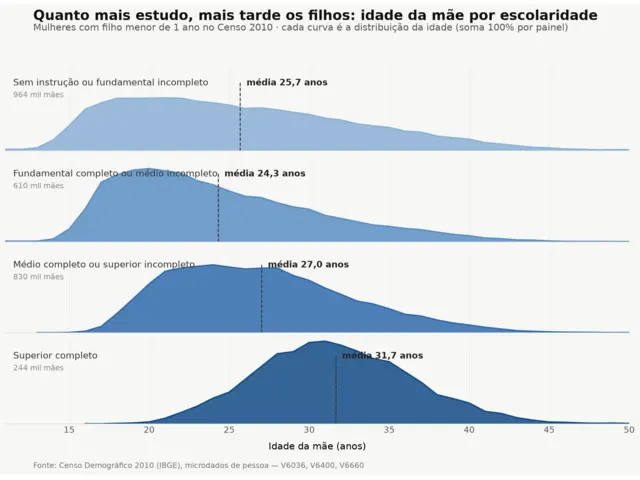
Dark map of the state of Rio de Janeiro formed by millions of luminous dots, each representing an active company registrationEvery dot is a company, in Rio de Janeiro 3D map of the state of Rio de Janeiro with vertical spikes marking the concentration of religious establishmentsRio's religious density in three dimensions Map of Brazil formed by dots marking every religious establishment in the countryEvery church in the country Low birth weight and prematurity by mother's age and race, SINASC 2022Race shifts the risk curve Fertility vs. education across Evangelical denominations, 2010 CensusFertility and education among Evangelicals Choropleth map of Brazil with municipalities colored by the average wage of formal employment contracts in RAISThe RAIS Wage Atlas Distribution of mother's age by education level, 2010 CensusThe more schooling, the later the children Map of Brazil with municipalities colored from yellow (Catholic predominance) to purple (Evangelical predominance)The religious profile of each municipality See all at DataViz

WebDocs (6)

Narratives made of data: one-to-three-minute stories in which the camera travels across the map, set to music, and every point becomes part of the plot.
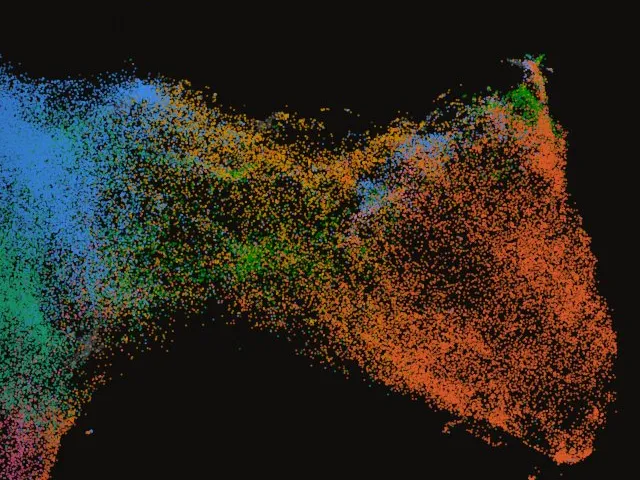
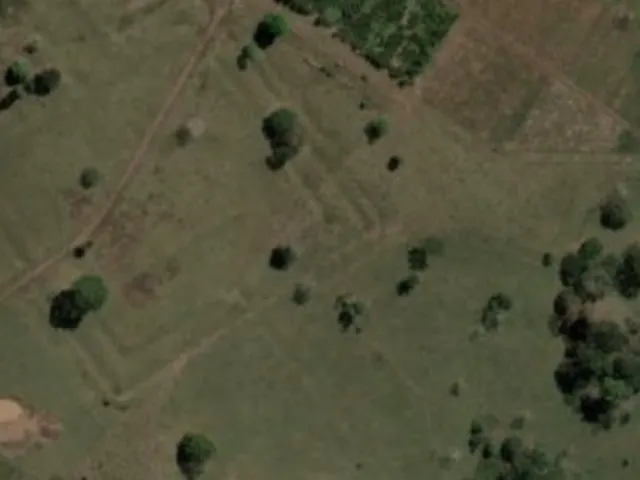
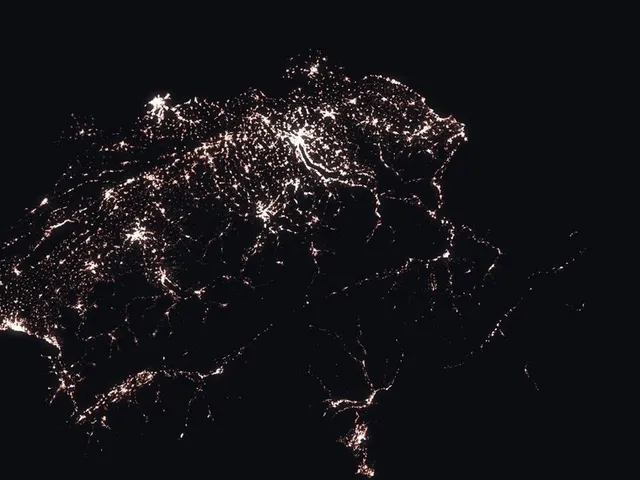
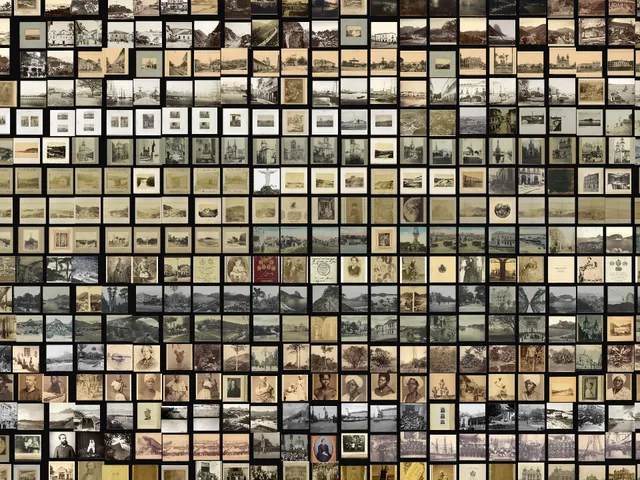
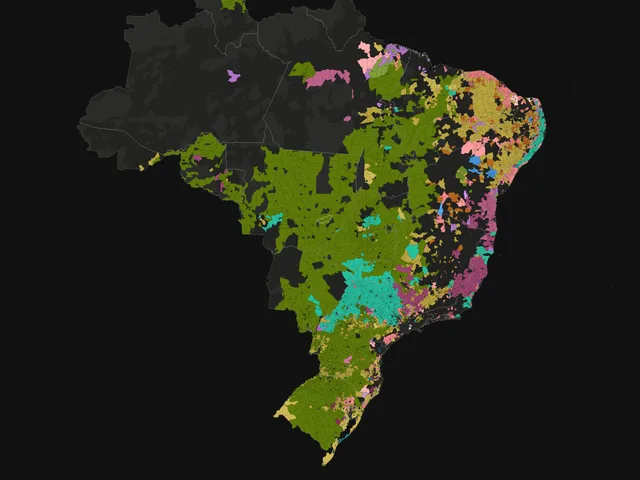
79 thousand music tracks spread on a map, coloured by genre, what sounds alike sits closeTocador — an Atlas of 79 thousand tracks 462 thousand river reaches, coloured by streamflowBrazil's rivers by streamflow Satellite view of a geoglyph in Acre, geometric ditches amid pastureGeoglyphs of the Amazon Switzerland at night, made of its 795 thousand registered companies, one light per buildingCantography — Switzerland's companies Wall of thousands of historical photographs from the Brasiliana Fotográfica collection, 1820 to 2022Brasiliana Fotográfica — 13 thousand photos, 1820 to 2022 Brazil municipality by municipality, coloured by the crop family that takes the most land in 2024Chão — Brazil's countryside, 1974 to 2024

Analyses in English (2)

2026-10-05Brazil's public real-world data: what it covers, how it links, what it can and can't answer13 billion rows of Brazilian public health data, three decades of it, and not a single patient ID.Ministry of Health / DATASUS · SIH, SIA, SIM, SINASC, SINAN, SISVAN, SI-PNI, CNES 2026-09-06What the data reveals about BrazilBacked by a congressional earmark, a funding deal is 5.5 times likelier to get signed.INPE · PRODES/DETER All analyses (mostly in Portuguese)

The data behind the analyses

Interact with the public data behind all of this, and more.
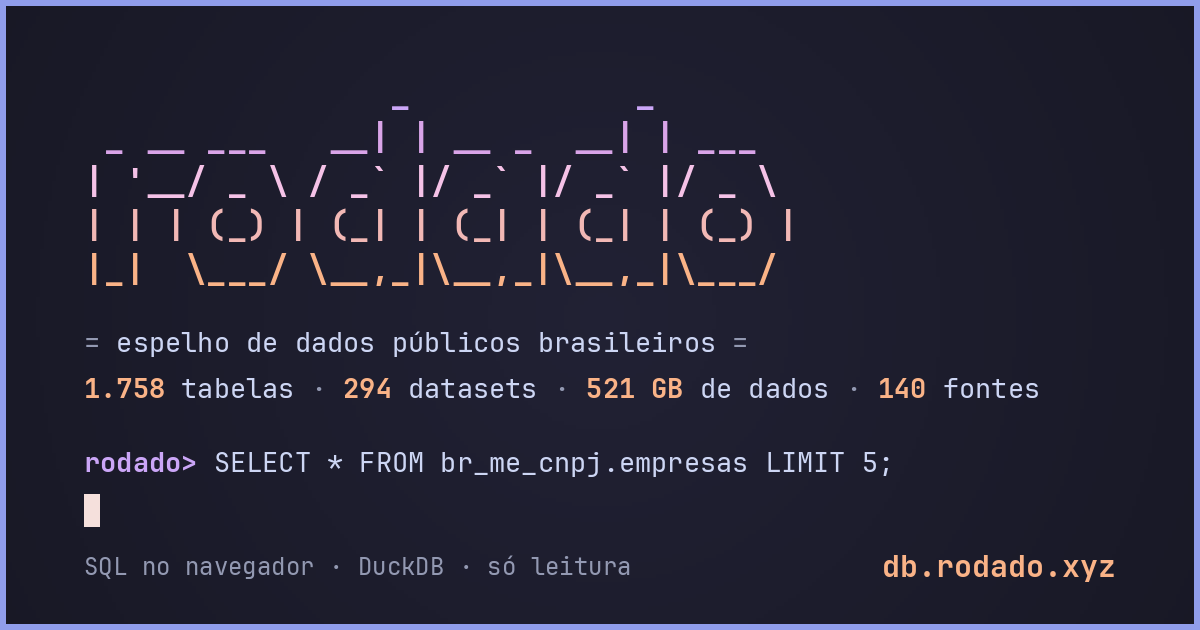
rodado terminal with the ASCII logo and a sample SQL query

db.rodado.xyz

Every analysis here comes from the same mirror of public data (1,758 tables, 294 datasets, 140 sources, 521 GB), open for querying over the same data each analysis used.

  • terminala read-only SQL terminal in the browser.
  • /llmto research with an agent (LLM, script, notebook): the HTTP path, from topic to query.
  • /indexqueries saved by people using the terminal, each one a short link that opens already running.