Analysis

Brazil's public real-world data: what it covers, how it links, what it can and can't answer
Brazil runs one of the largest single-payer health systems in the world, the SUS, and publishes the administrative trail of almost everything it does: every public hospital admission, every outpatient procedure it pays for, every death certificate, every live birth, every case of a notifiable disease. Most of it is record-level, national and free. For anyone who works with real-world data (RWD) in pharma, that is an unusual resource: a population of 213 million, three decades deep, with no licence fee.
It is also unusual in what it lacks. There is no patient identifier in any public file, so nothing links at person level. Coverage, coding and completeness change from source to source and from year to year. This piece maps what is there, measures how the pieces fit, and is explicit about what the data can and cannot support. Everything below was measured on a local copy of the official files in October 2026.
The inventory
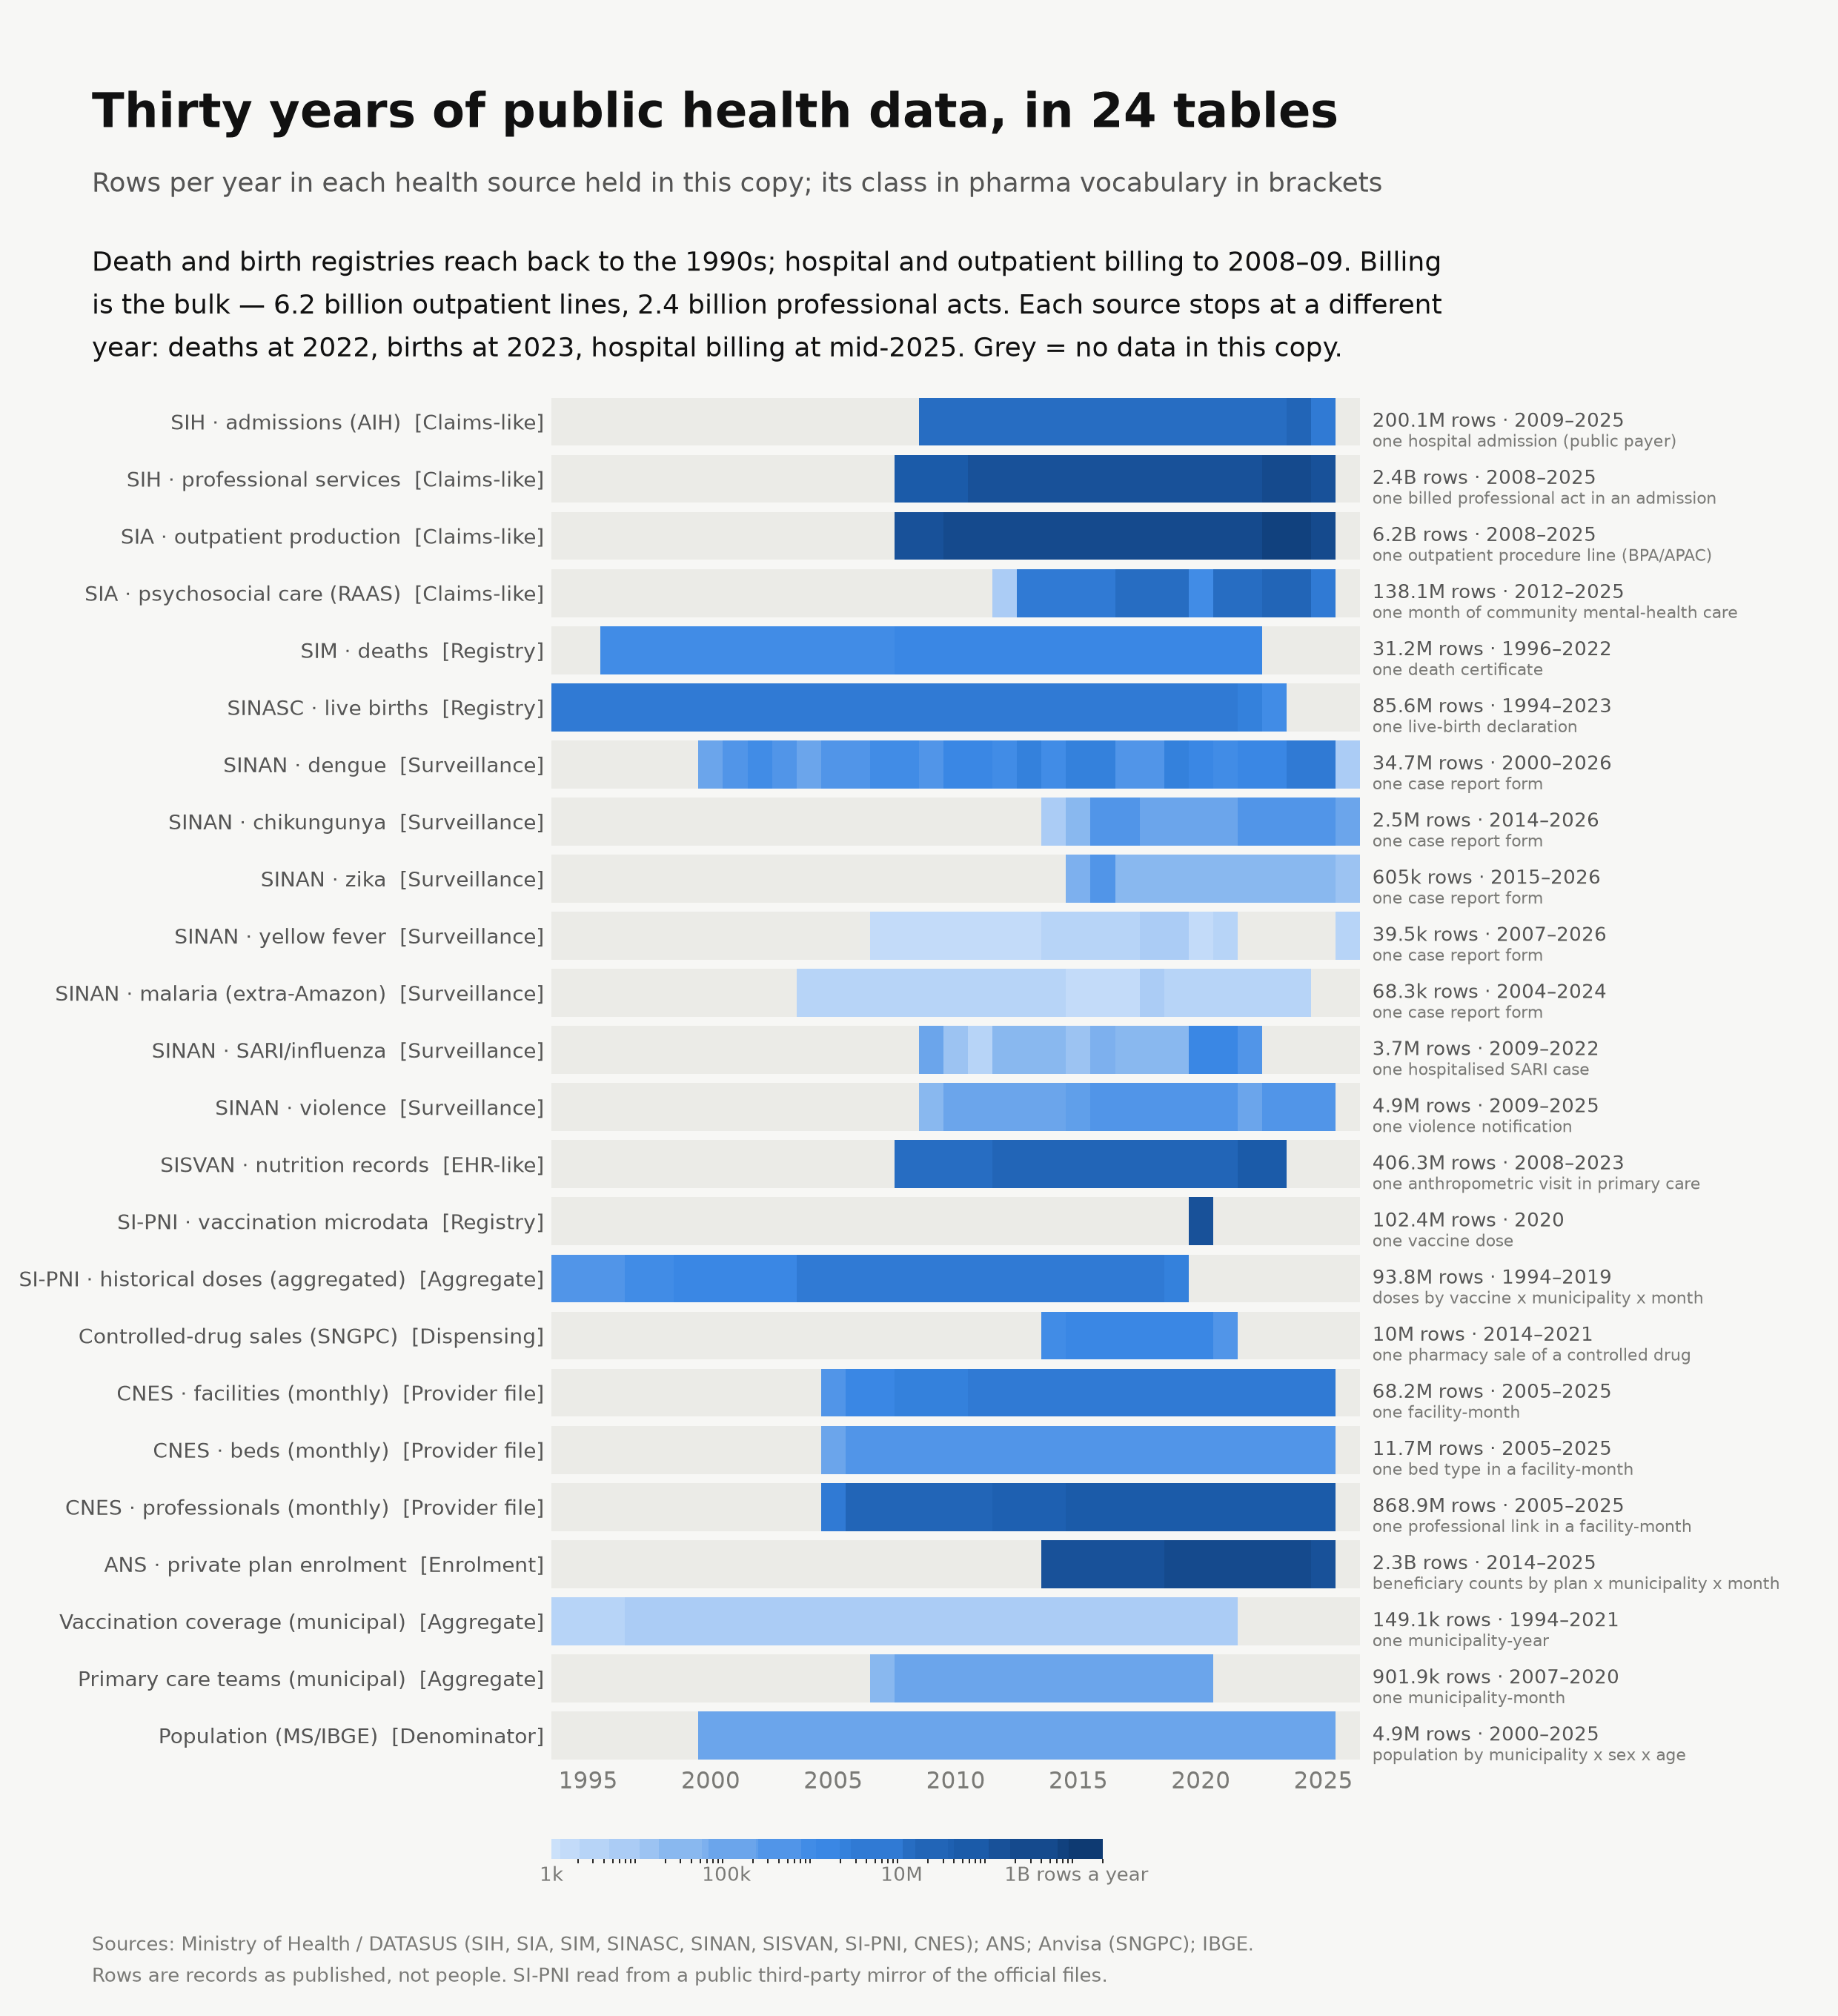
Twenty-four tables, 13 billion rows. Grouped by what they would be called in a pharma RWD team:
| Source | Years | Records | Unit of record | Pharma analogue |
|---|---|---|---|---|
| SIH, hospital admissions | 2009–2025 | 200 M | one admission paid by SUS: ICD-10, dates, procedures, ICU days, amount paid, death in hospital | inpatient claims, single public payer |
| SIH, professional services | 2008–2025 | 2.4 B | one billed professional act within an admission | claims line items |
| SIA, outpatient production | 2008–2025 | 6.2 B | one outpatient procedure line; individual records (APAC) carry ICD-10 and cover oncology, dialysis, high-cost drugs | outpatient and specialty-pharmacy claims |
| SIA, psychosocial care | 2012–2025 | 138 M | one month of community mental-health care | outpatient episode records |
| SIM, deaths | 1996–2022 | 31 M | one death certificate: underlying and contributing causes (ICD-10), place, age, sex, race | national death index |
| SINASC, live births | 1994–2023 | 86 M | one live-birth declaration: gestational age, birth weight, mother's age and education, congenital anomalies | birth registry |
| SINAN, notifiable diseases | 2000–2026 | 46 M | one case report form: dengue, chikungunya, zika, yellow fever, malaria, severe acute respiratory infection, violence | disease surveillance registries |
| SISVAN, nutrition | 2008–2023 | 406 M | one anthropometric visit in primary care | EHR extract (vitals only) |
| SI-PNI, vaccination | 1994–2019; 2020 microdata | 94 M + 102 M | doses by vaccine and municipality; one dose per record in the 2020 microdata | immunisation registry |
| CNES, providers | 2005–2025 | 950 M | facility, bed and professional, monthly | provider master file |
| ANS, private insurance | 2014–2025 | 2.3 B | beneficiary counts by plan type, municipality and month | enrolment / eligibility file, aggregated |
| SNGPC, controlled drugs | 2014–2021 | 10 M | one pharmacy sale of a controlled drug, with prescriber state and ICD-10 | pharmacy dispensing (partial copy) |
| Population | 2000–2025 | 4.9 M | residents by municipality, sex and age | denominators |
A few observations come straight out of the timeline. The registries are the oldest, from the mid-1990s. Billing data start in 2008–09. Each source closes at a different year: deaths at 2022, births at 2023, hospital billing at mid-2025, surveillance into 2026. A study period that needs all of them ends in 2022. The billing tables are the volume: 6.2 billion outpatient lines and 2.4 billion professional acts.
The copy of the controlled-drug sales file stops at exactly 10 million rows, with 2021 truncated. It is useful for exploring, not for counting.
How it links: place, facility, diagnosis, time
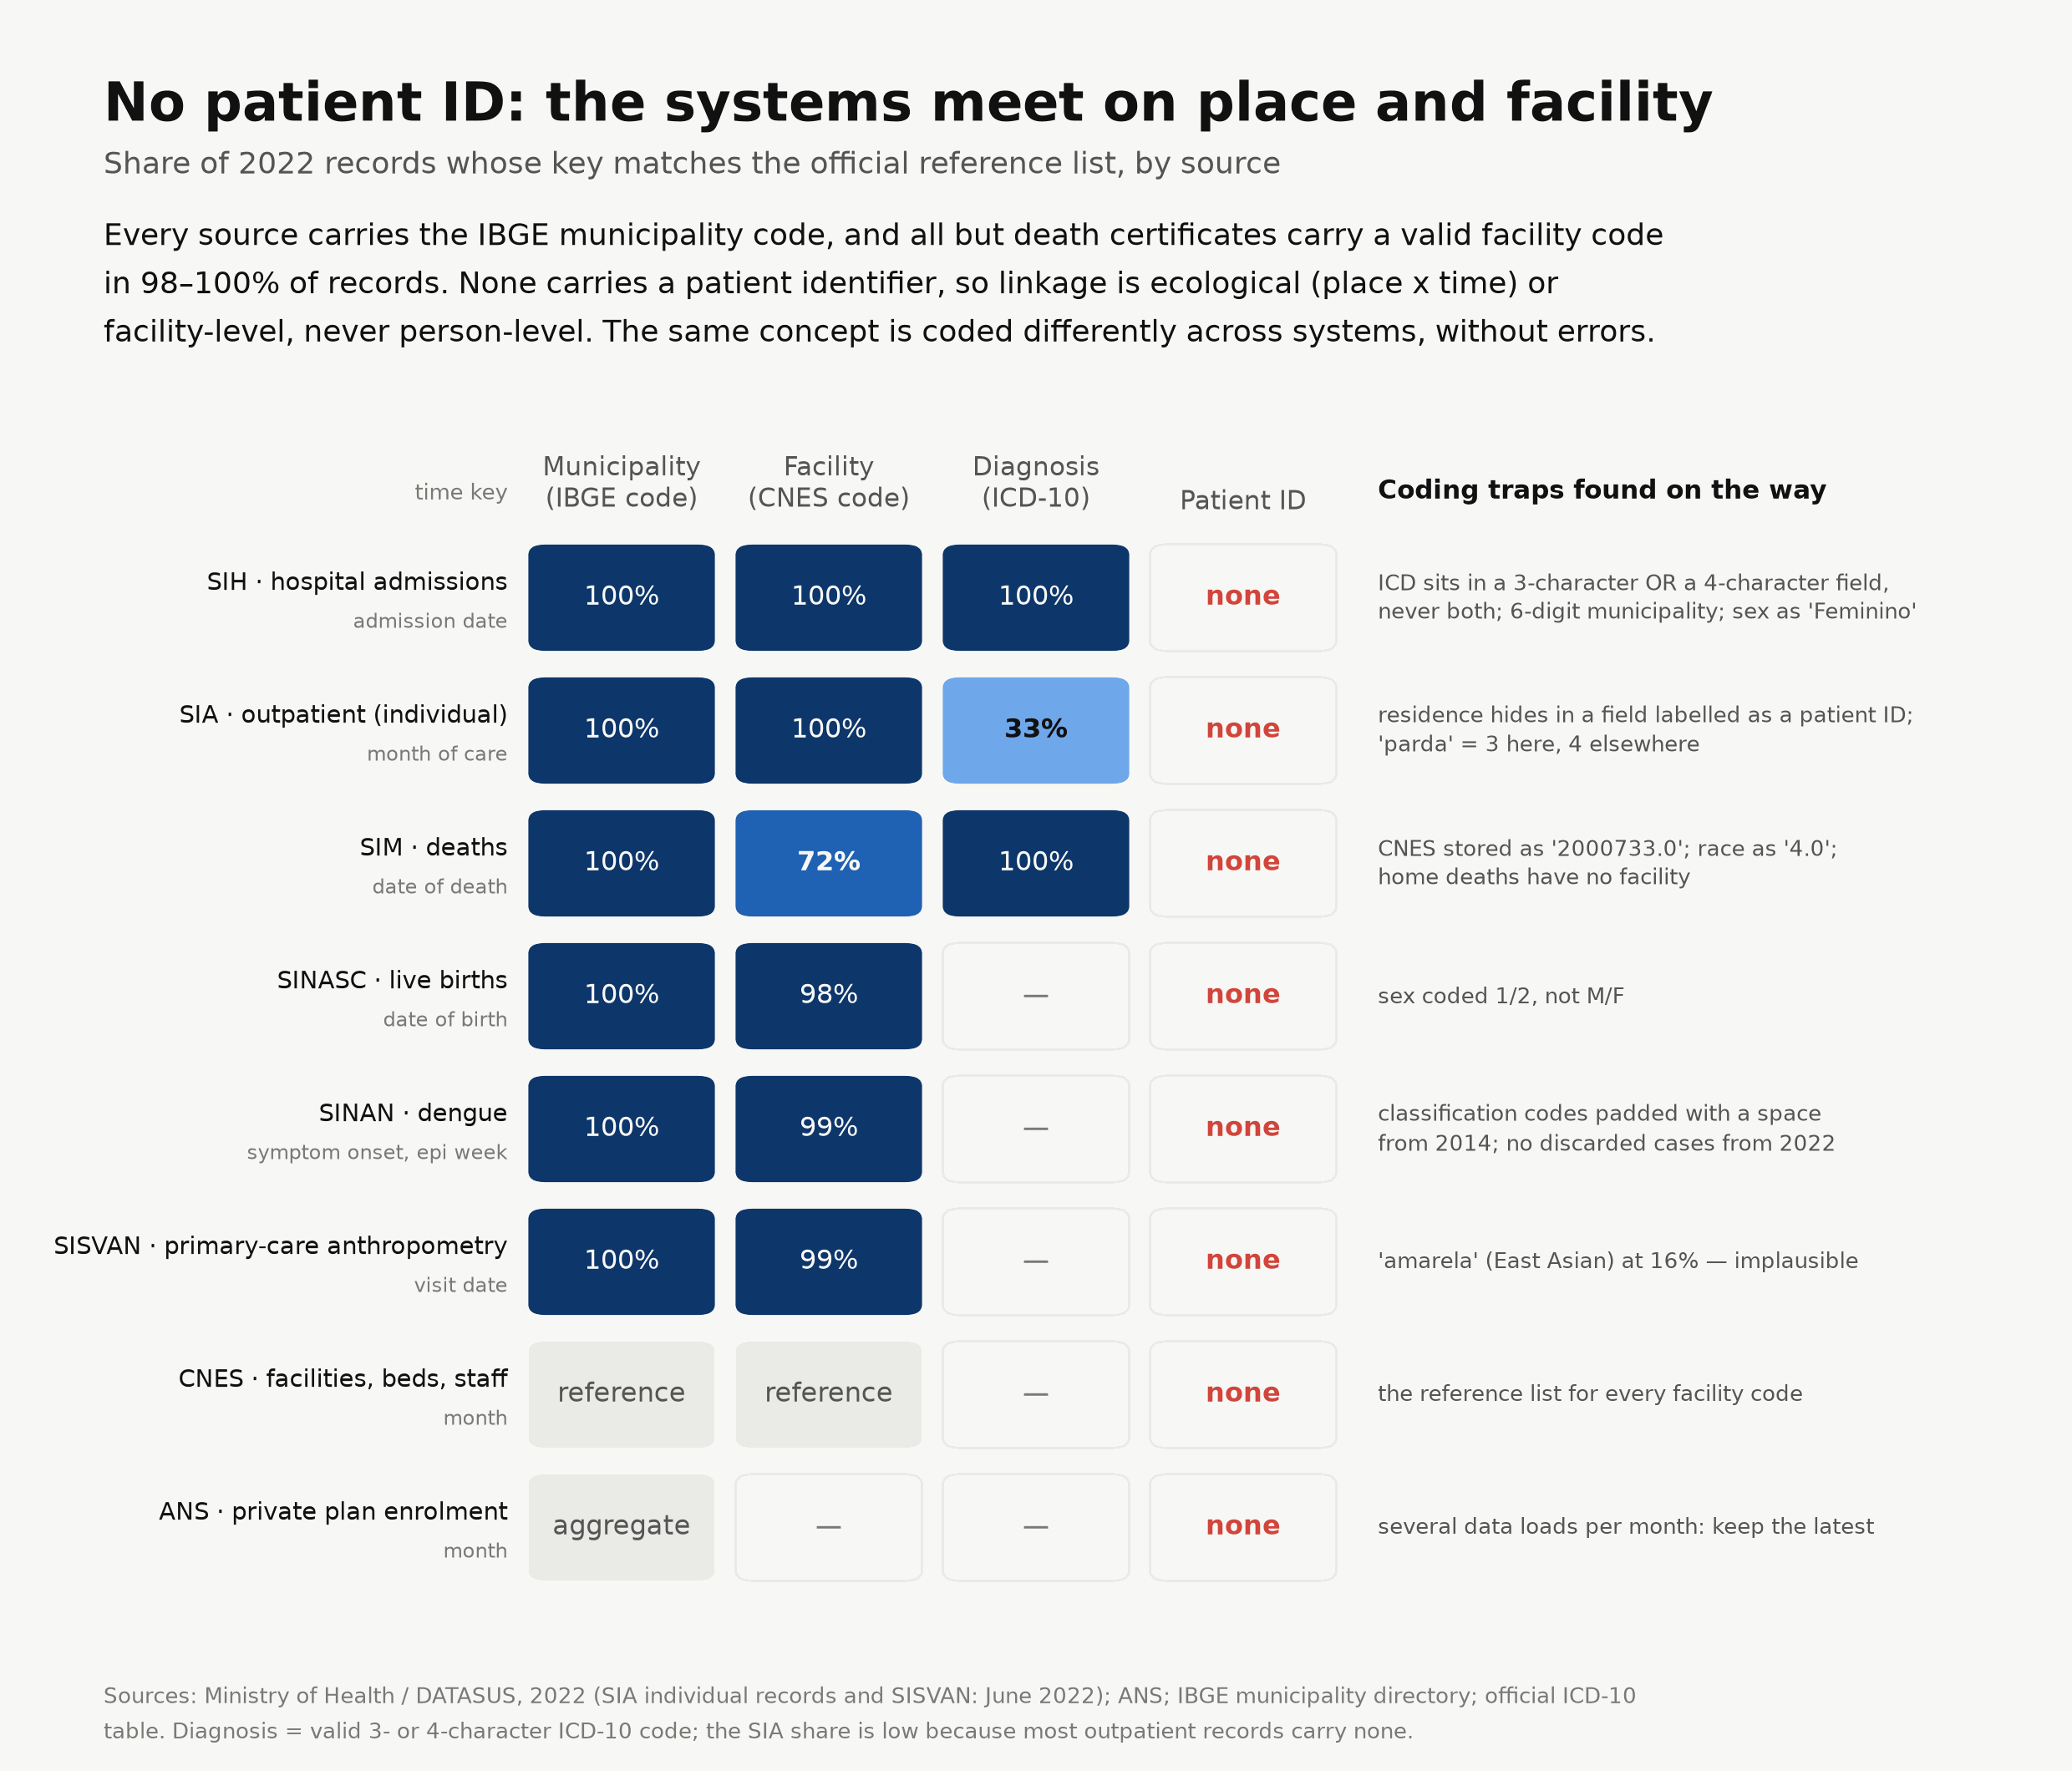
No public file carries a patient identifier. SUS has one, the national health card number, but it is stripped before publication. Every cross-source analysis therefore links on four shared keys:
- Municipality (IBGE code), present in every source. It matches the official list for 99.6–100% of 2022 records.
- Facility (CNES code), present in every source except where care happens at home. It matches the facility registry for 98–100% of records, and for 72% of death certificates (deaths at home have no facility).
- Diagnosis (ICD-10), in hospital, outpatient and death records. Valid codes in 99.99% of admissions and deaths. Notification forms are disease-specific and need none.
- Time: date of admission, death or birth; epidemiological week in surveillance; billing month in claims.
So linkage is ecological (municipality × period × diagnosis) or facility-level (what happens in a given hospital), never person-level. That rules out cohorts that follow a patient from diagnosis to death across systems. It still allows most descriptive and ecological designs, and facility-level studies of quality and volume.
The second lesson is less obvious: the same concept is coded differently in every system, and nothing fails when it is mixed up. Measured on 2022 records:
- Sex is the word "Feminino" or "Masculino" in hospital admissions, the codes 1 and 2 in death and birth records, and F or M in outpatient, surveillance and nutrition files. In the severe-acute-respiratory-infection file it is empty for every record, 2009–2022.
- Race/colour "parda" (mixed) is code 3 in outpatient billing and code 4 in deaths, births, surveillance and nutrition, where 3 means "amarela" (East Asian). Joining the two by code silently swaps the largest group in the country with one of the smallest.
- Diagnosis in hospital admissions is stored in a 3-character field or a 4-character field, never both: 89% of admissions have only the 4-character code. Filtering on the 3-character field alone loses nine admissions in ten. Outpatient authorisations repeat the split: read only the 3-character field and 2024 specialised-drug records look 96% undiagnosed, when every one of them carries a code.
- Municipality has 7 digits in deaths and births and 6 (no check digit) in hospital and outpatient billing. In outpatient billing the patient's municipality sits in a field labelled as a patient ID.
- Facility code on death certificates is stored as a decimal ("2000733.0") and matches nothing until it is cleaned.
None of these raises an error. Each produces a result that looks plausible.
Fit for purpose, measured
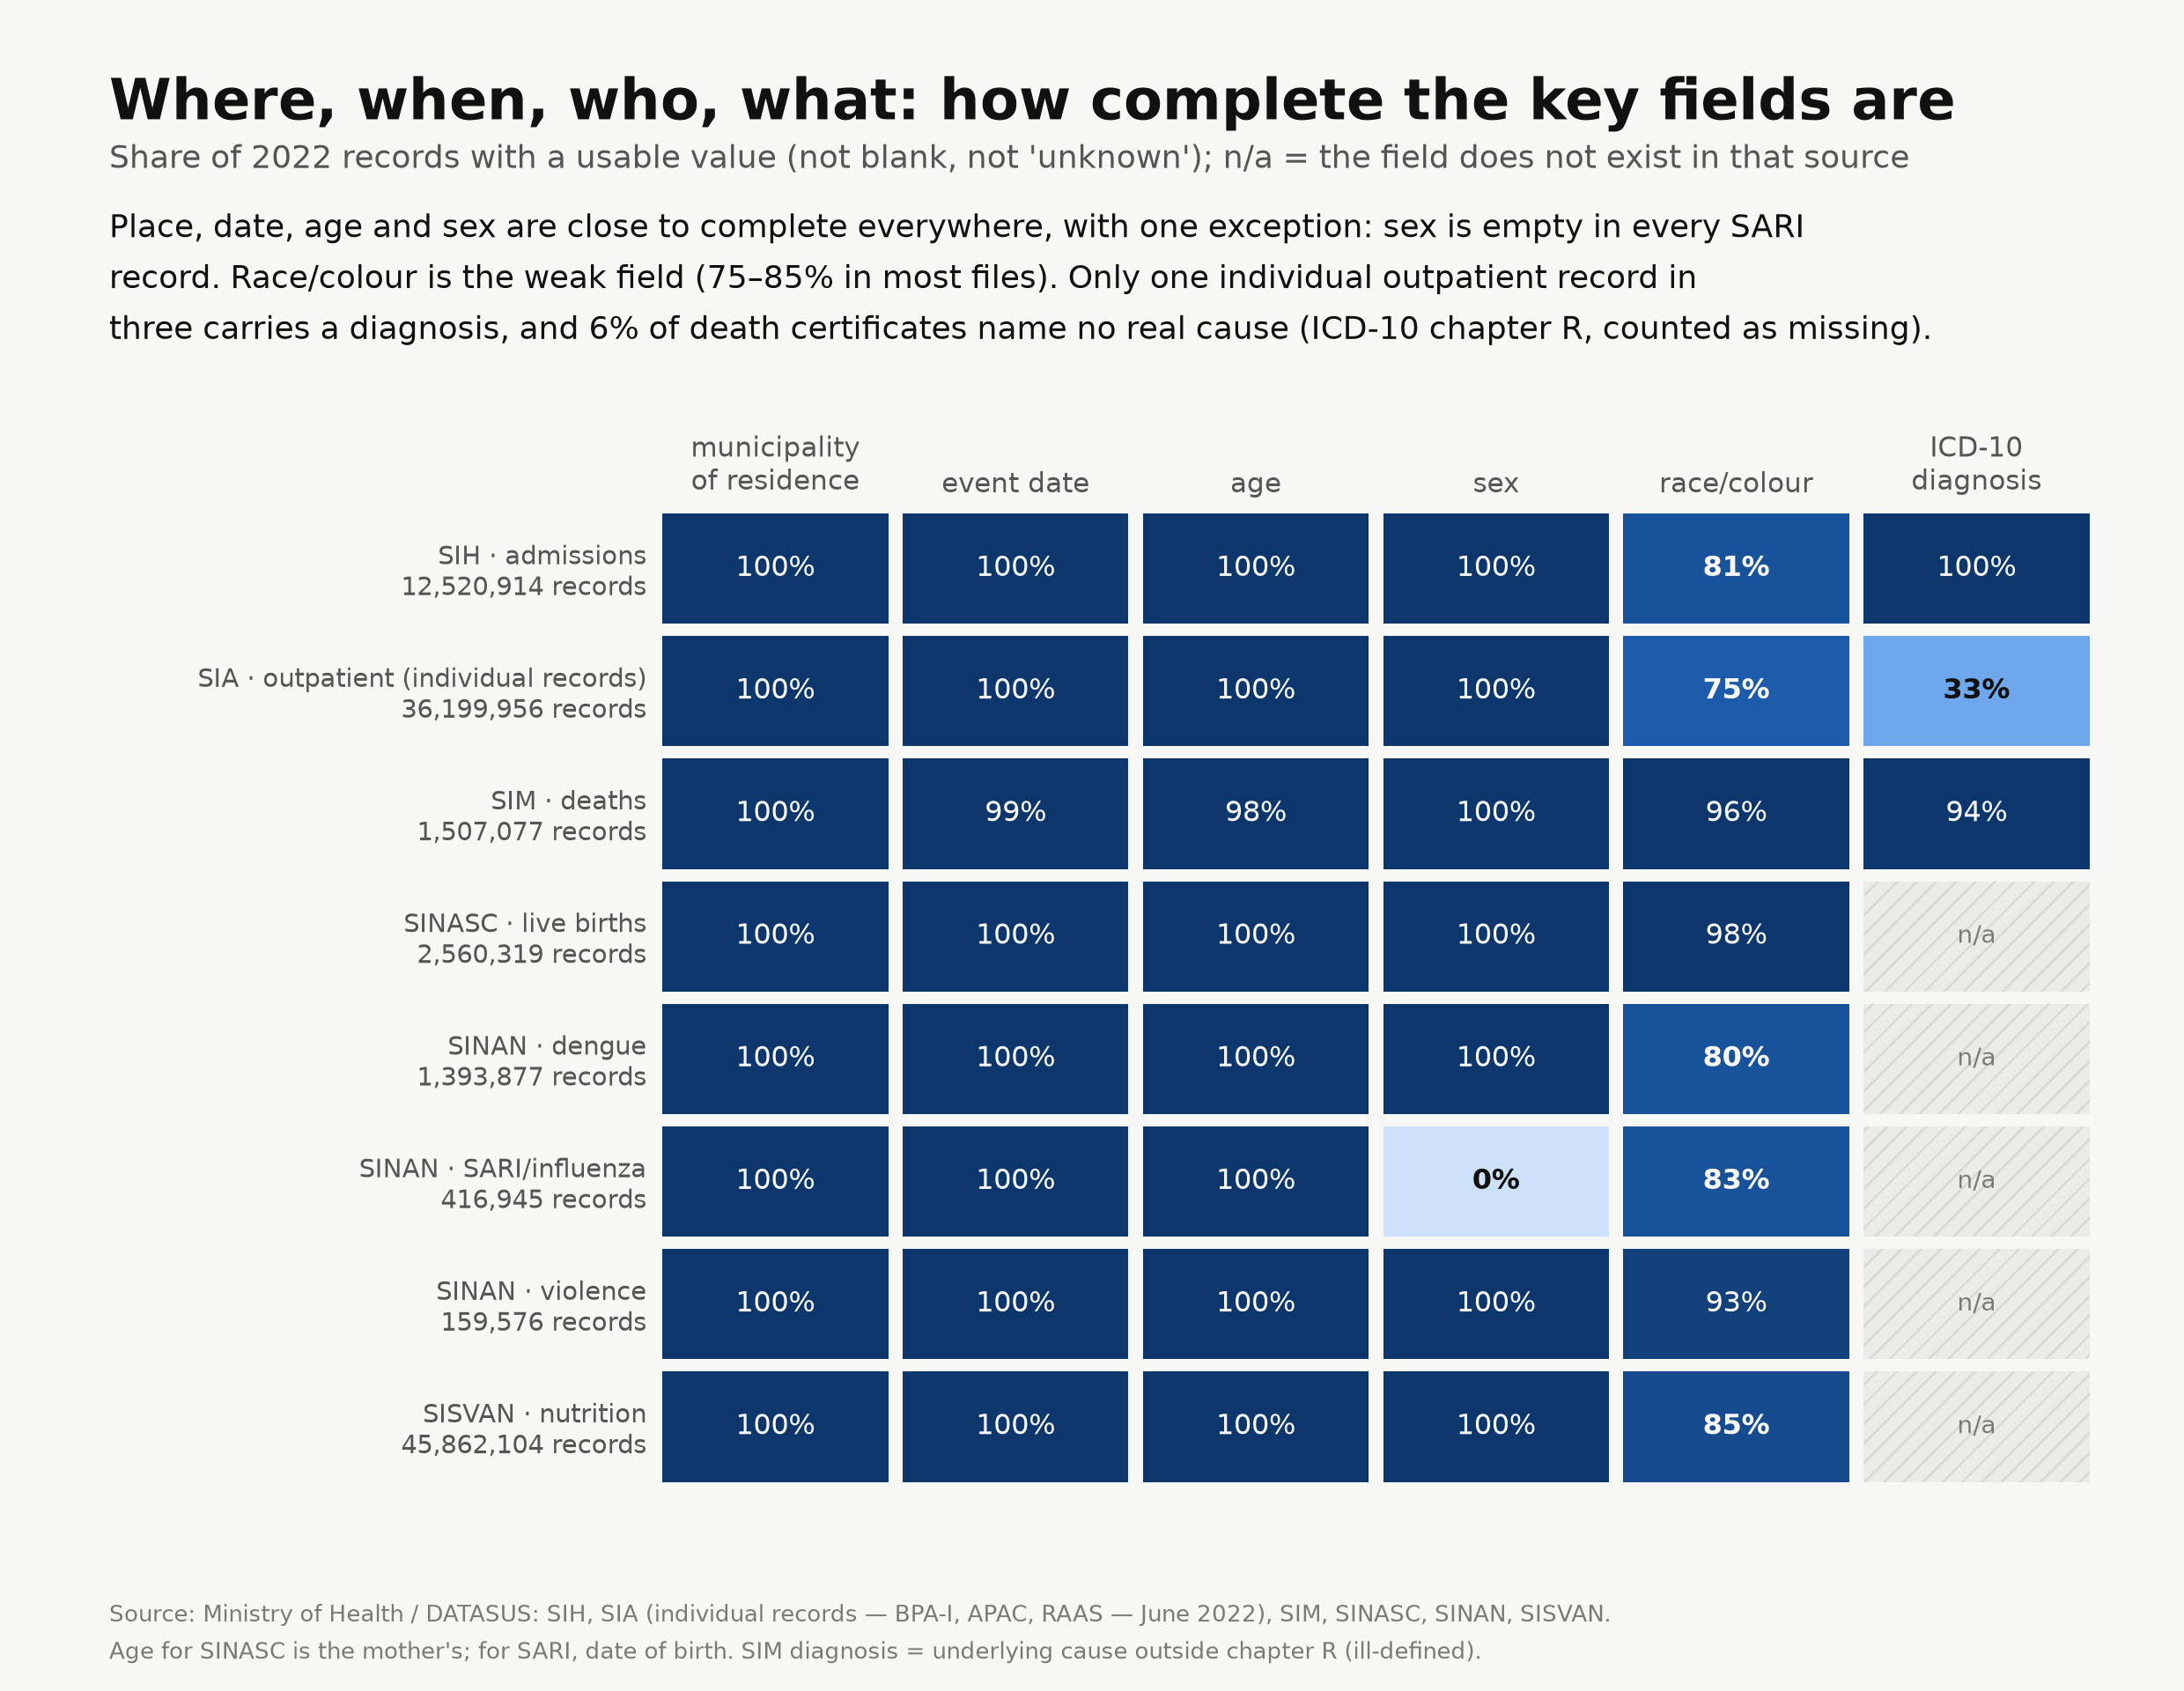
In FDA and EMA terms, the question is not whether the data are good but whether they are good enough for a given question. Five dimensions, measured.
Completeness. Place, date, age and sex are close to complete in every source, with the exception noted above. Race/colour is the weak field: 75% in outpatient records, 80–85% in admissions, dengue notifications and nutrition records, 96–98% in deaths and births. Only a third of individual outpatient records carry an ICD-10 code. The bulk of outpatient production is reported in consolidated form, with no patient at all.
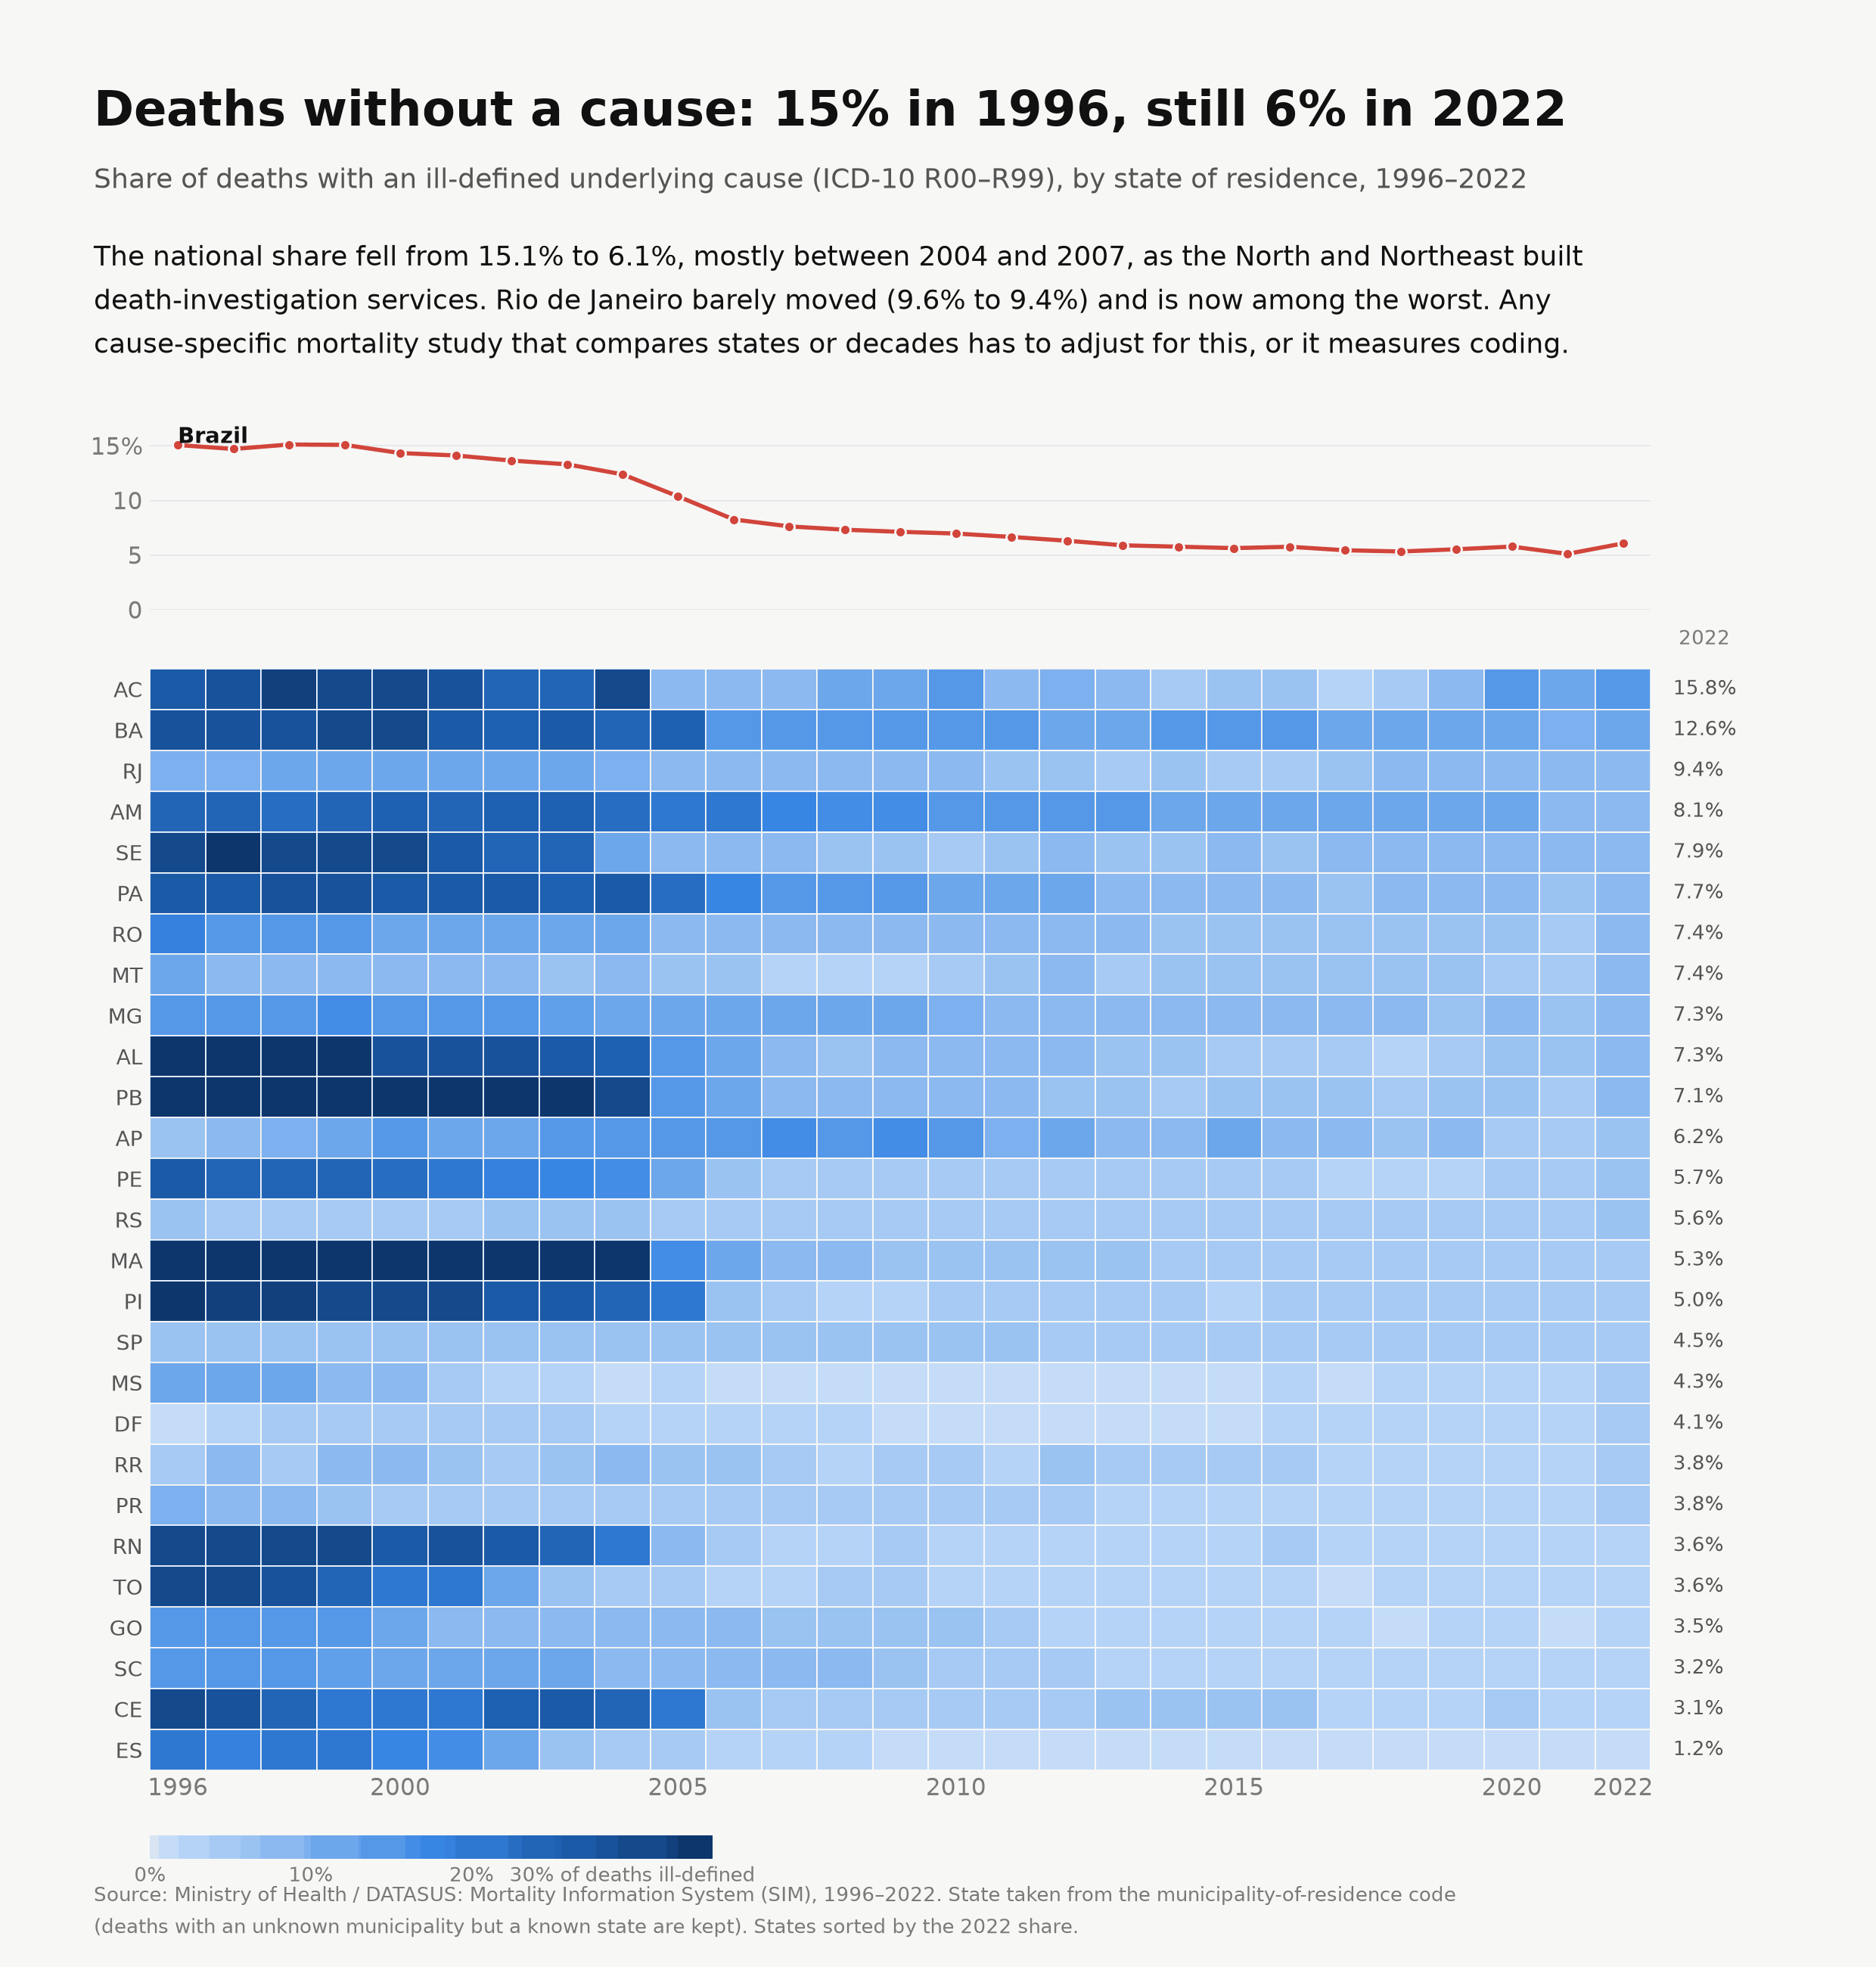
Cause-of-death quality. In 1996, 15.1% of deaths had an ill-defined underlying cause (ICD-10 R00–R99). By 2022 it was 6.1%, after a sharp fall in 2004–07 as northern and northeastern states set up death-investigation services. The fall was uneven: Rio de Janeiro went from 9.6% to 9.4% and is now third-worst. A cause-specific mortality comparison across states or decades that ignores this is partly measuring coding.
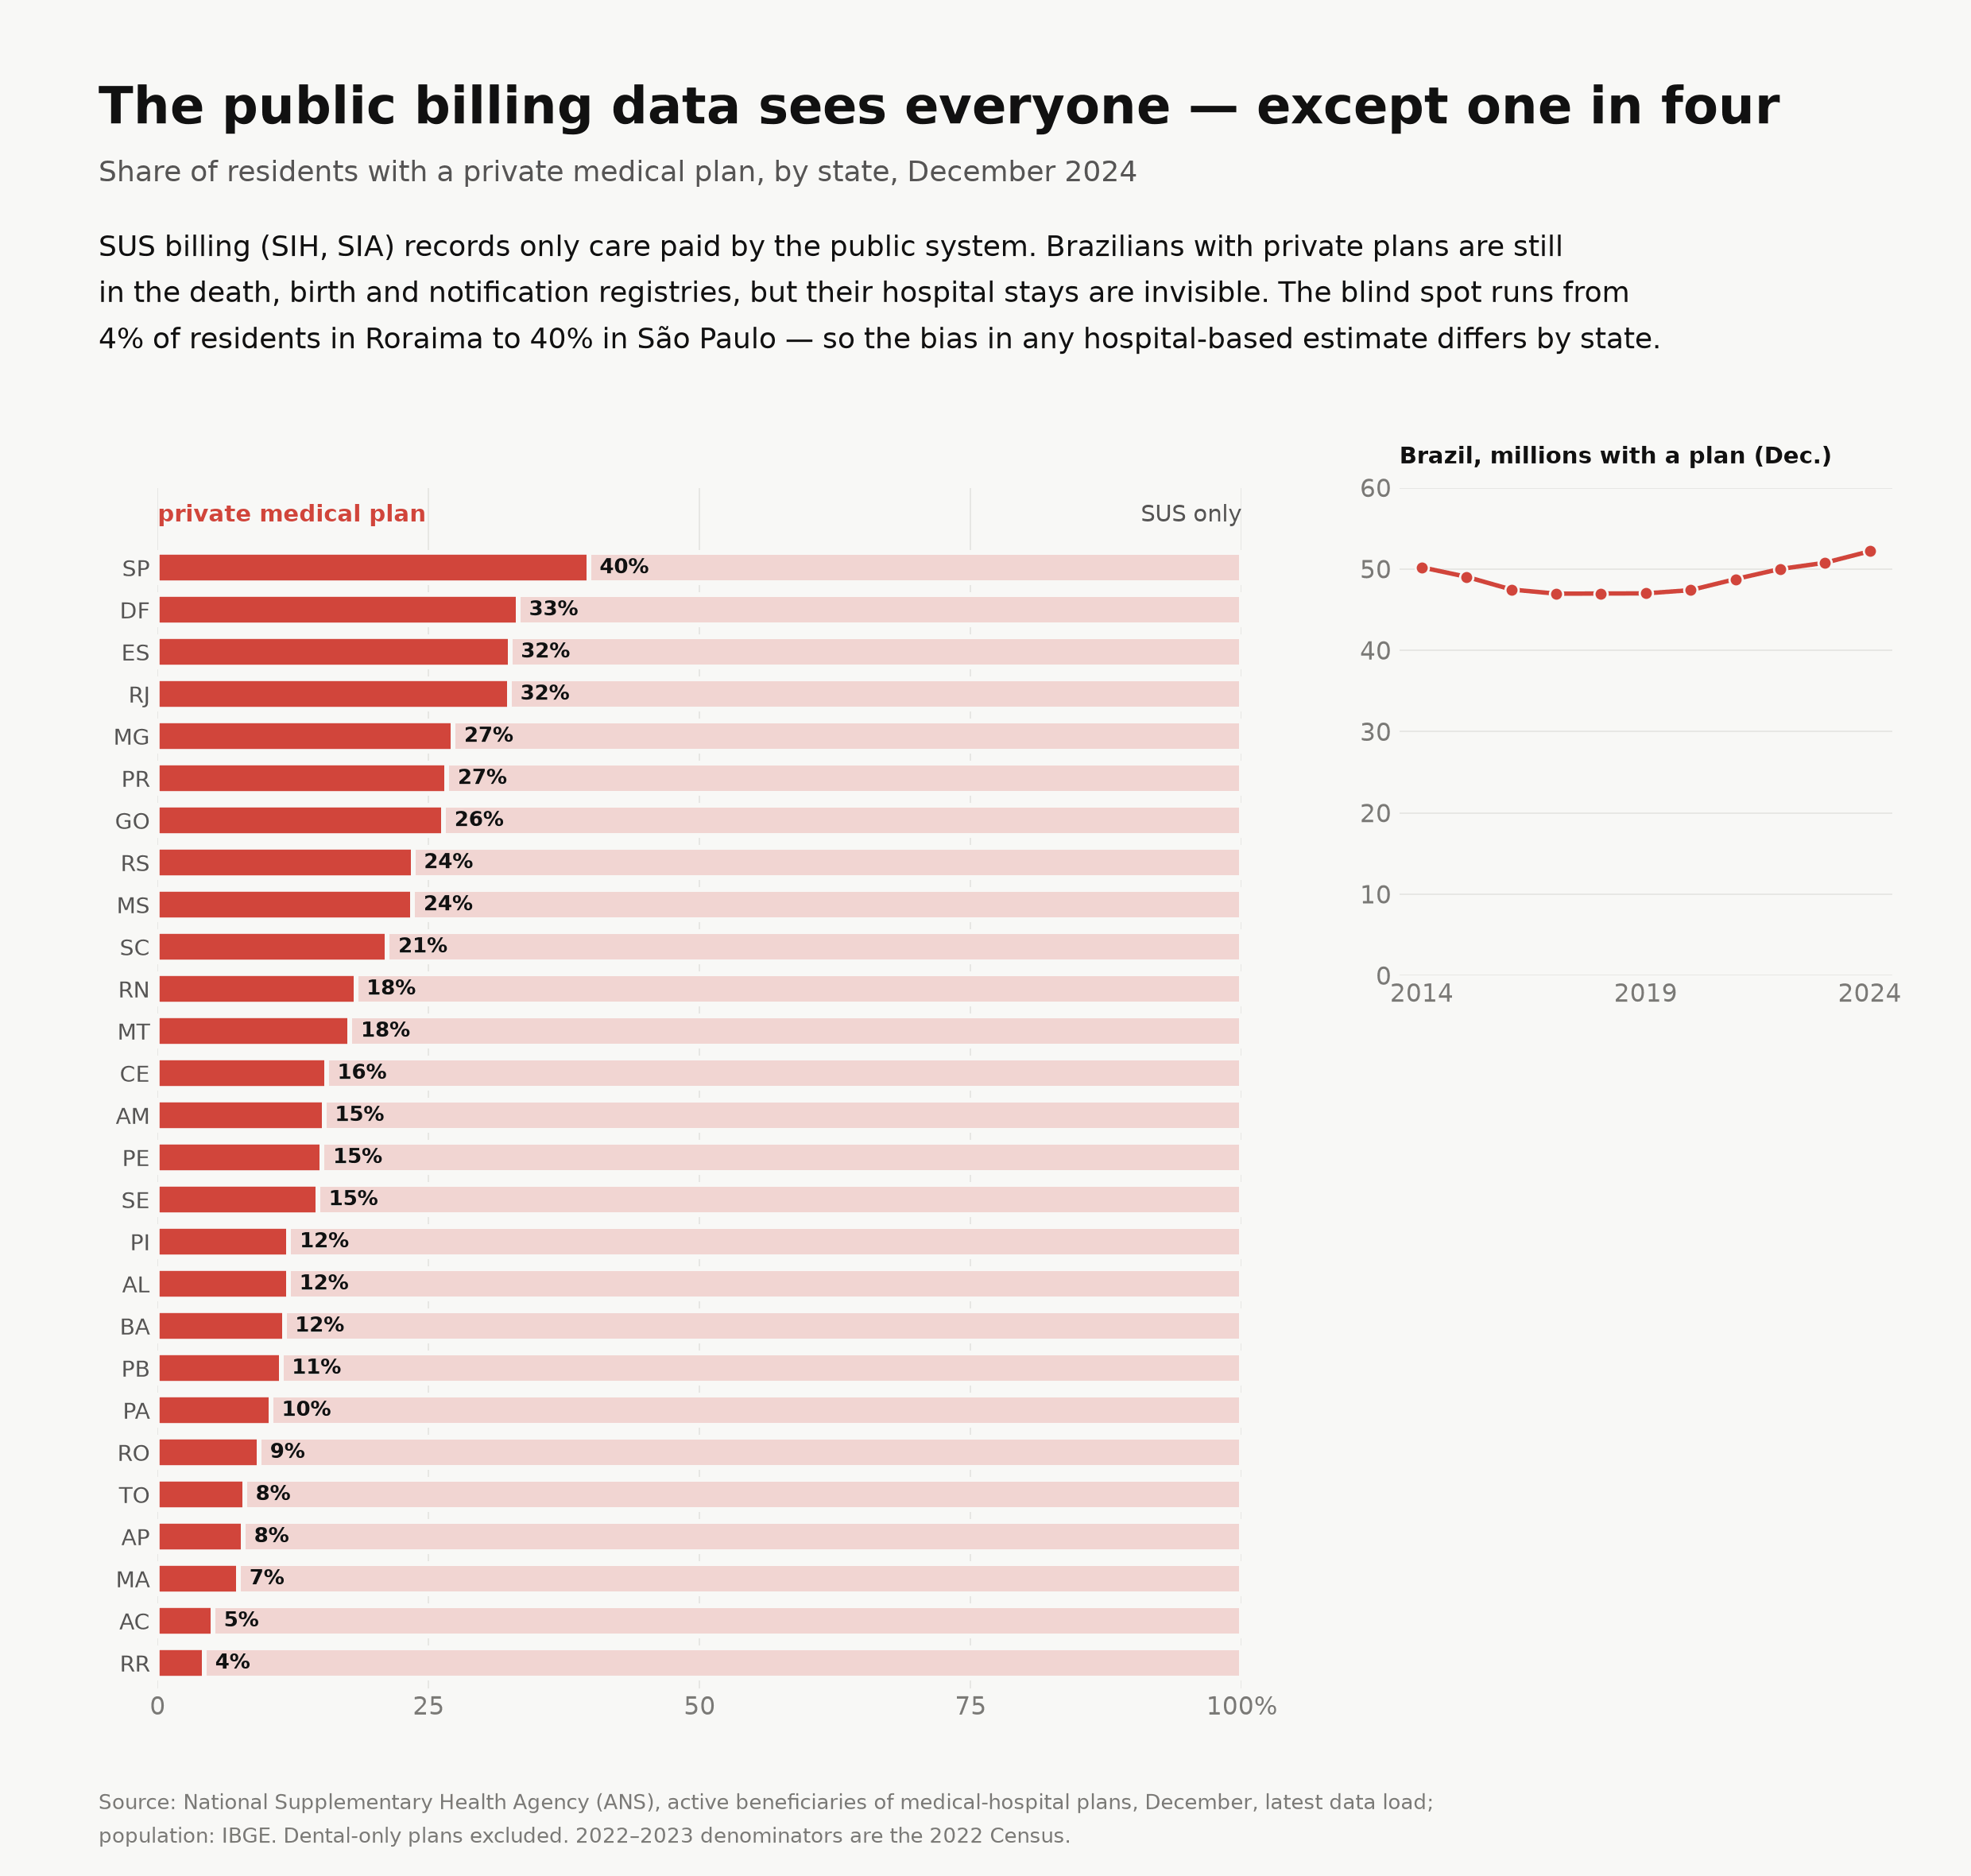
Coverage. The registries (deaths, births, notifications) cover everyone. The billing data cover only care paid by SUS. In December 2024, 52.2 million people, 24.6% of the population, held a private medical plan, from 4% in Roraima to 40% in São Paulo. Their admissions are invisible to the hospital data. Any hospital-based rate is therefore biased by state, and in the same direction as income. Private plan enrolment is published only as counts, so it can correct denominators but not identify patients.
Timeliness and lag. Billing data are processed monthly and arrive within months. An admission is billed in the month of discharge or later, so the billing year is not the year of care. Death-certificate microdata are released as final about two years after the year of death, and the latest year in this copy is 2022. Surveillance records are notified a median of 3 days after symptom onset, but the case is closed weeks later: the median time from notification to closure for dengue fell from 31 days in 2014 to 14 in 2025.
Stability over time. Classifications change under the analyst's feet. Dengue moved to the WHO 2009 case definitions in 2014, with new codes. From 2022 the public dengue file no longer includes discarded notifications, so "all notifications" means something different before and after. Comorbidity fields on the dengue form were blank until 2015 and usable from 2017. One state, Espírito Santo, reported dengue in its own system in 2021–2024 and almost disappears from the national file, while its hospitals kept billing dengue admissions.
Privacy. Hospital and surveillance records include date of birth, sex, municipality and, in hospital data, postcode. Combined, they can single out individuals in small municipalities. Everything published here is aggregated, and cells with fewer than 10 events are suppressed.
Worked example 1: infant mortality from two registries
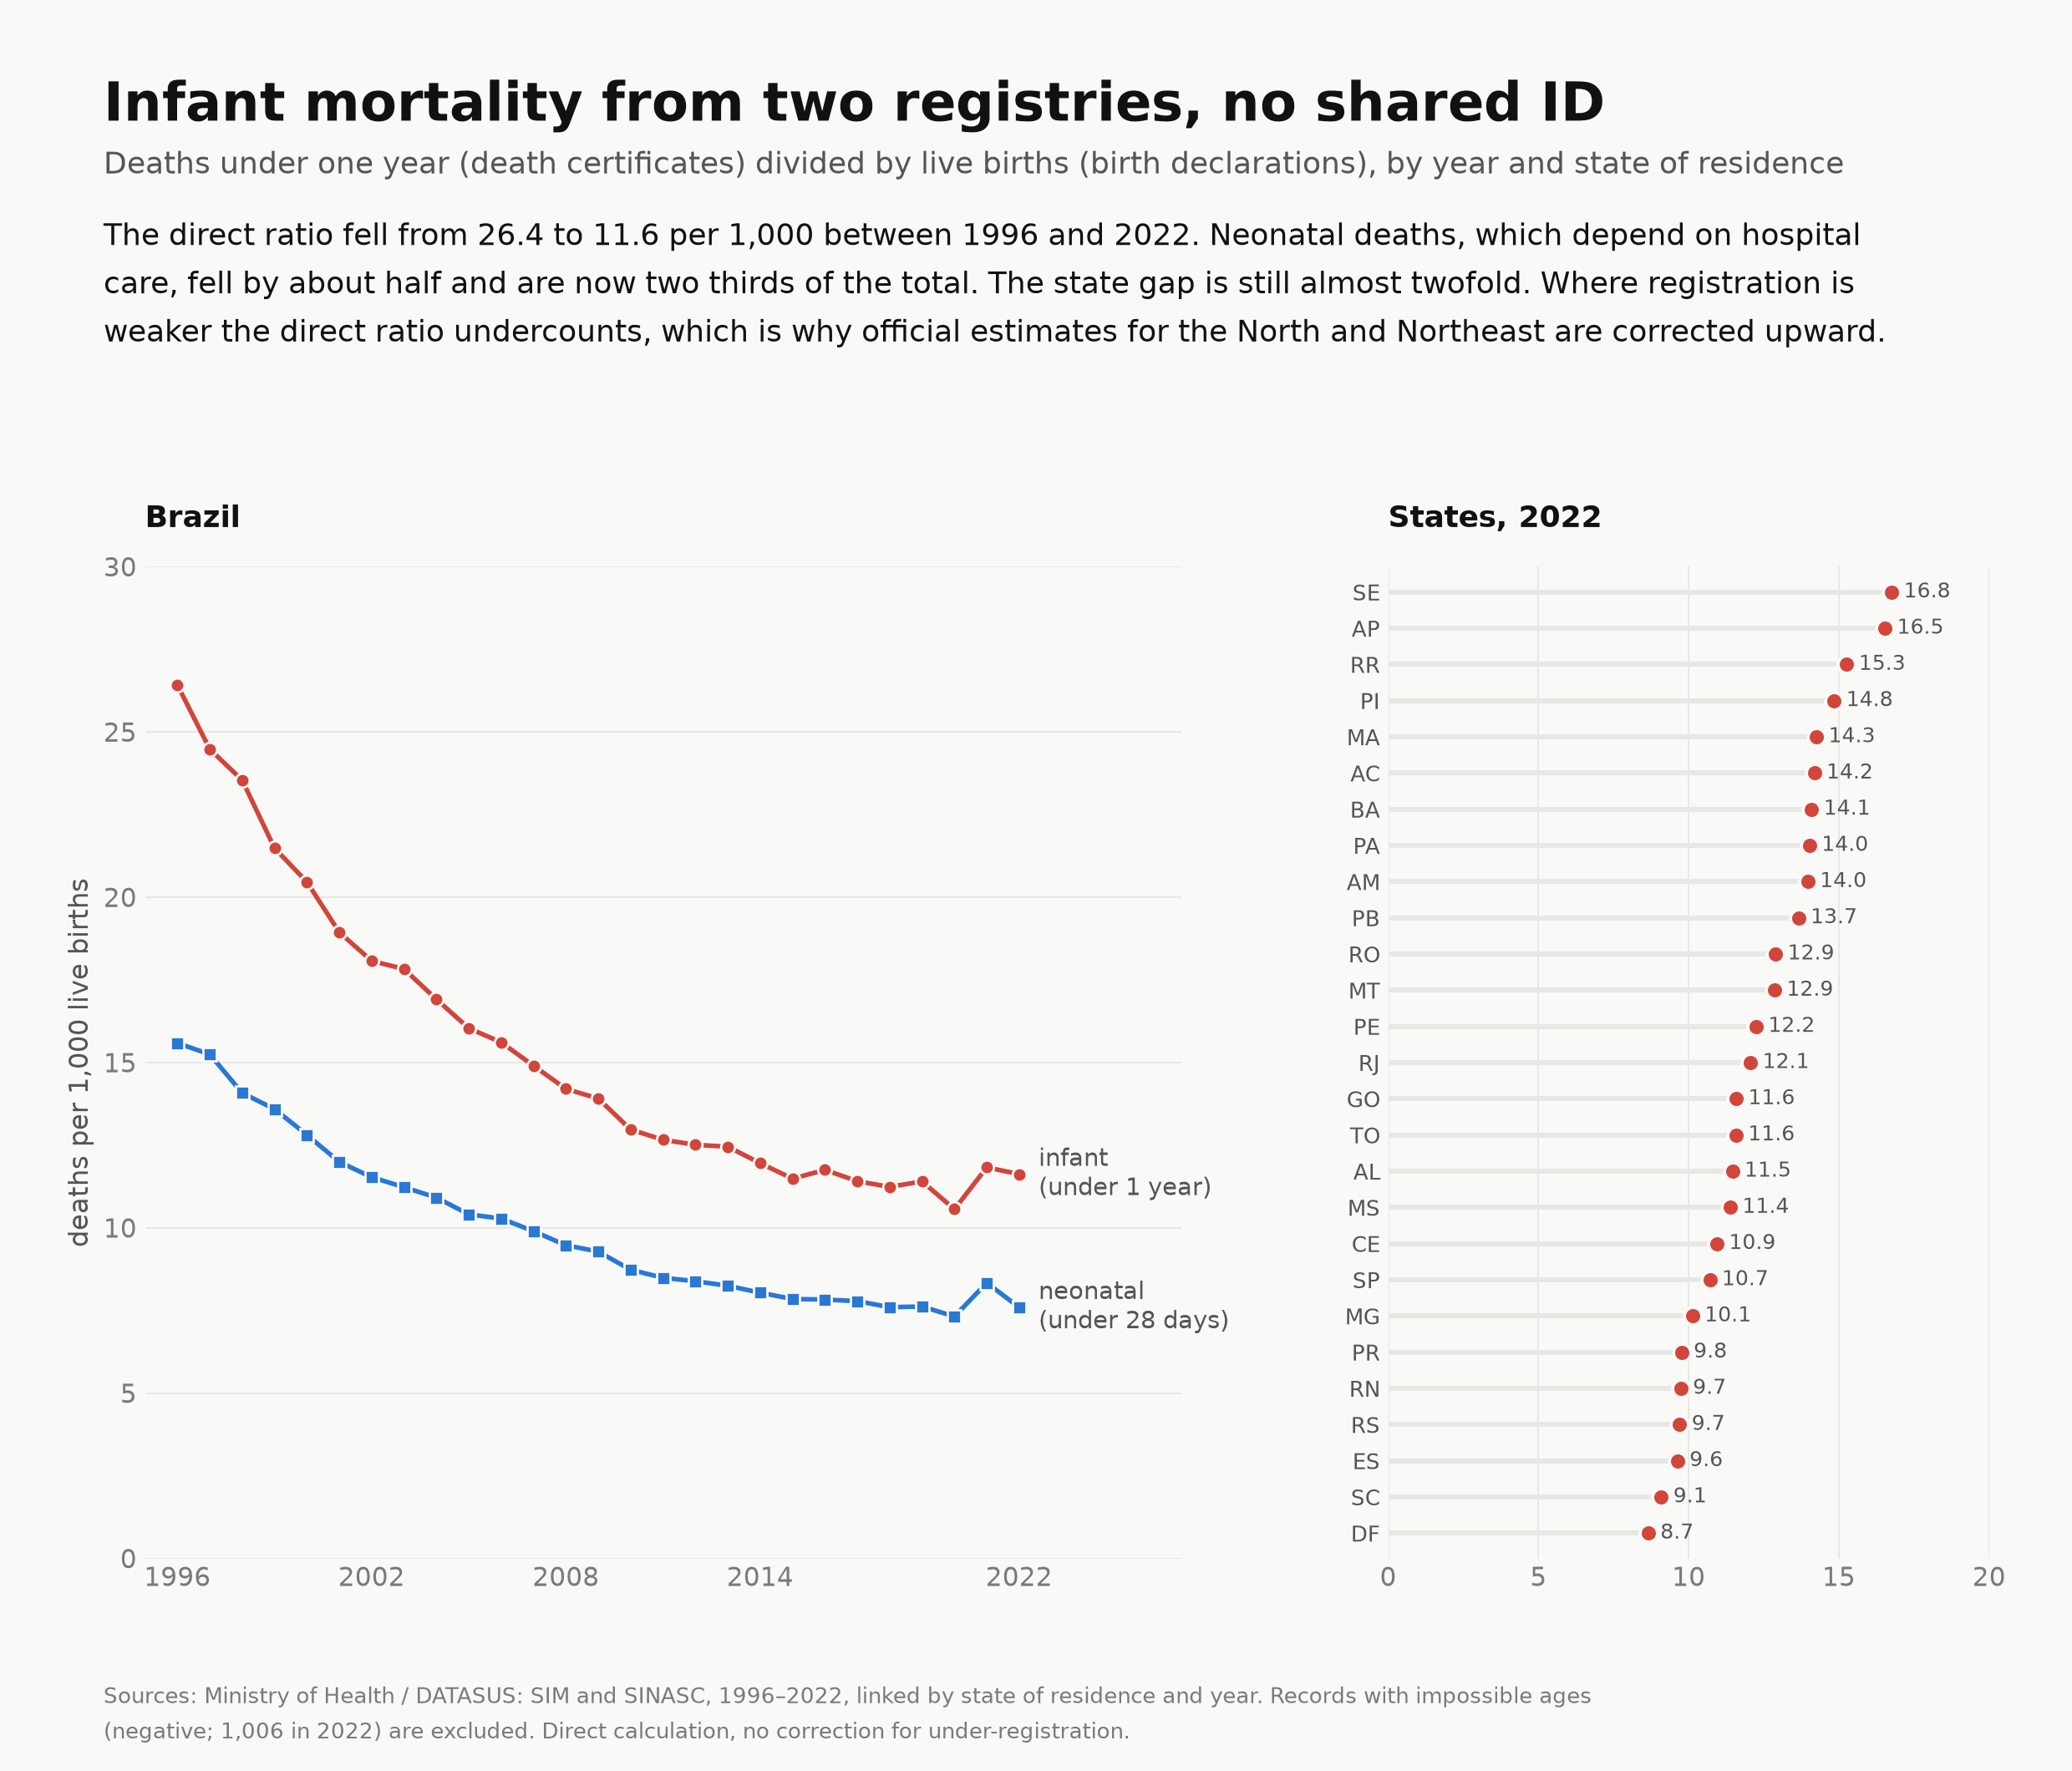
The infant mortality rate needs two registries: deaths under one year (SIM) divided by live births (SINASC). They share no identifier, but they share the residence municipality and the year, and that is enough for the rate. The direct ratio fell from 26.4 per 1,000 in 1996 to 11.6 in 2022. Neonatal deaths, in the first 28 days, depend more on hospital care. They fell by about half and are now two thirds of the total. Sergipe (16.8) and Amapá (16.5) are almost twice the Federal District (8.7).
The check is part of the example. In 2022 the death file has 30,791 records with age under one, 29,764 after removing 1,006 impossible negative ages and 21 records with no municipality. A second count by dates of birth and death gives 30,668. Where registration is weaker the direct ratio undercounts, which is why official estimates for the North and Northeast are corrected upward.
Worked example 2: dengue, from notification to hospital to death
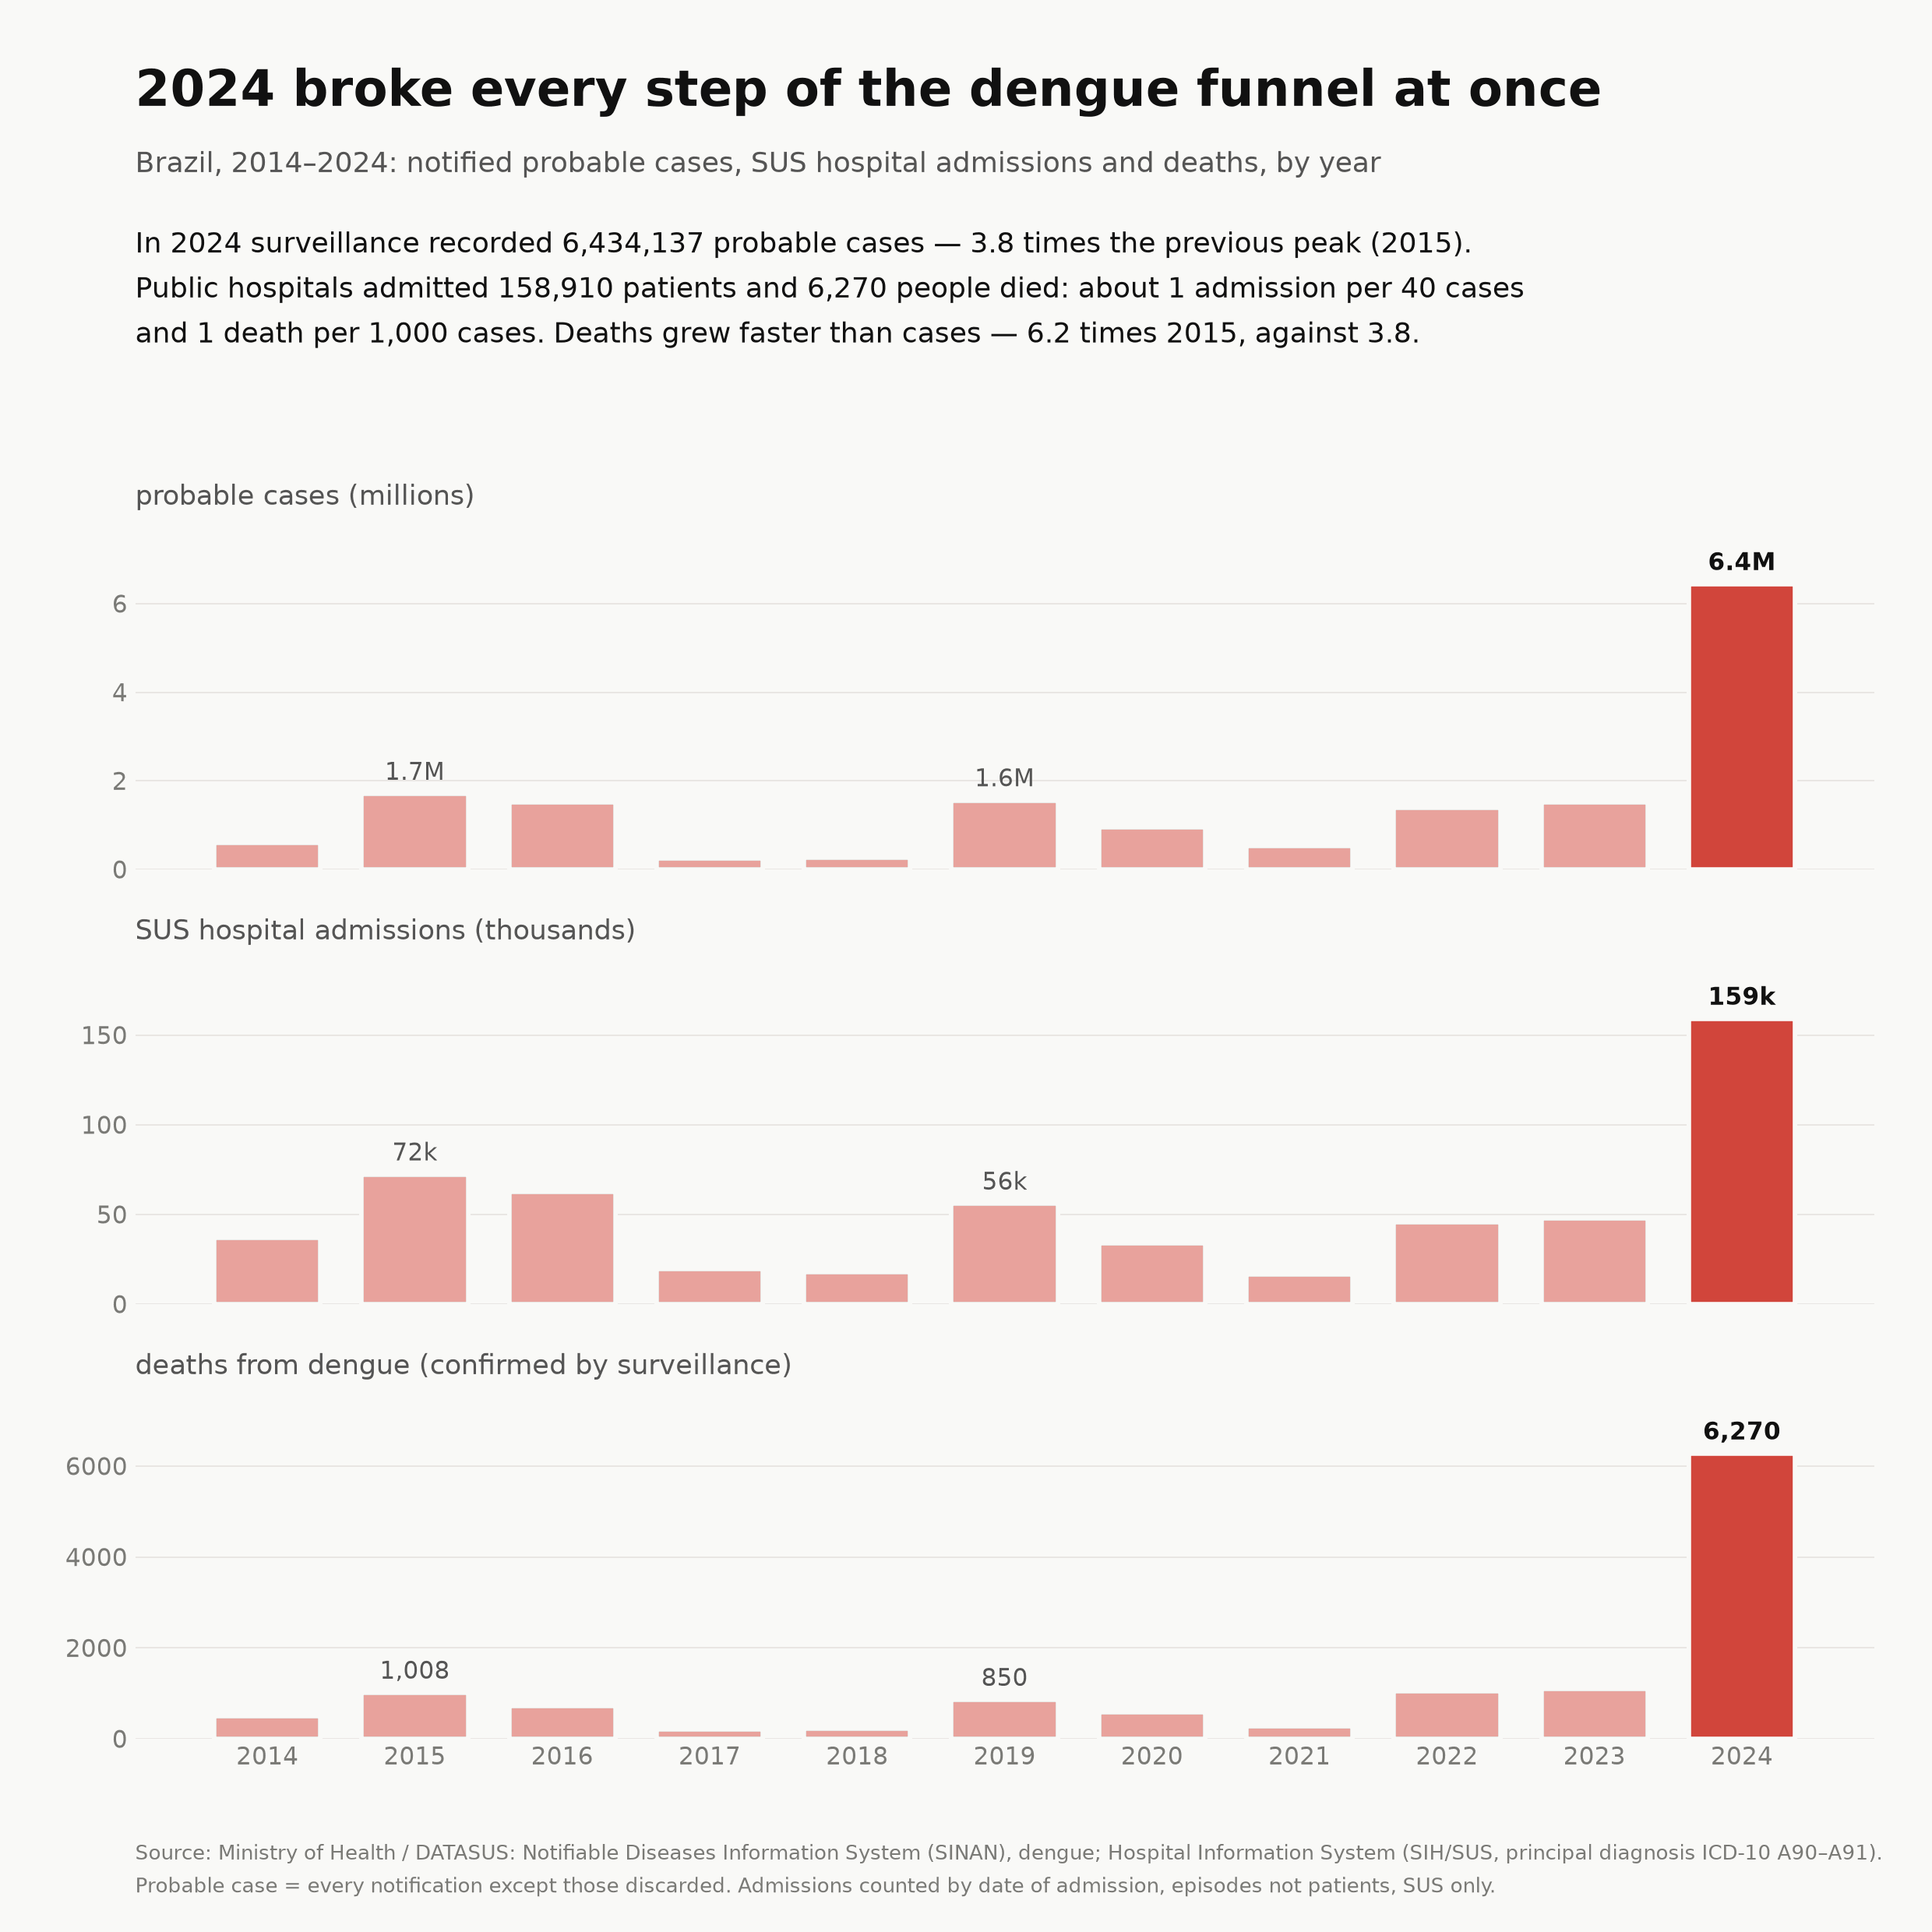
Dengue crosses three systems: notified in SINAN, admitted in SIH, certified in SIM. Between 2014 and 2024 surveillance recorded 16.7 million probable cases and 12,788 deaths. SUS hospitals billed 567,723 admissions for R$ 231.7 million. 2024 was off the scale: 6.4 million probable cases, 3.8 times the previous record, with 158,910 admissions and 6,270 deaths.
The series also shows how the hospital picture changed. In 2014 there was one SUS admission for every 16 probable cases; in 2024, one for every 40. In-hospital mortality among those admitted rose from 0.45% to 1.58%. Fewer patients reach a public bed, and those who do are sicker. That fits outpatient hydration of milder cases. It also fits more admissions moving to private hospitals, which SIH does not see. The data alone can't separate the two.
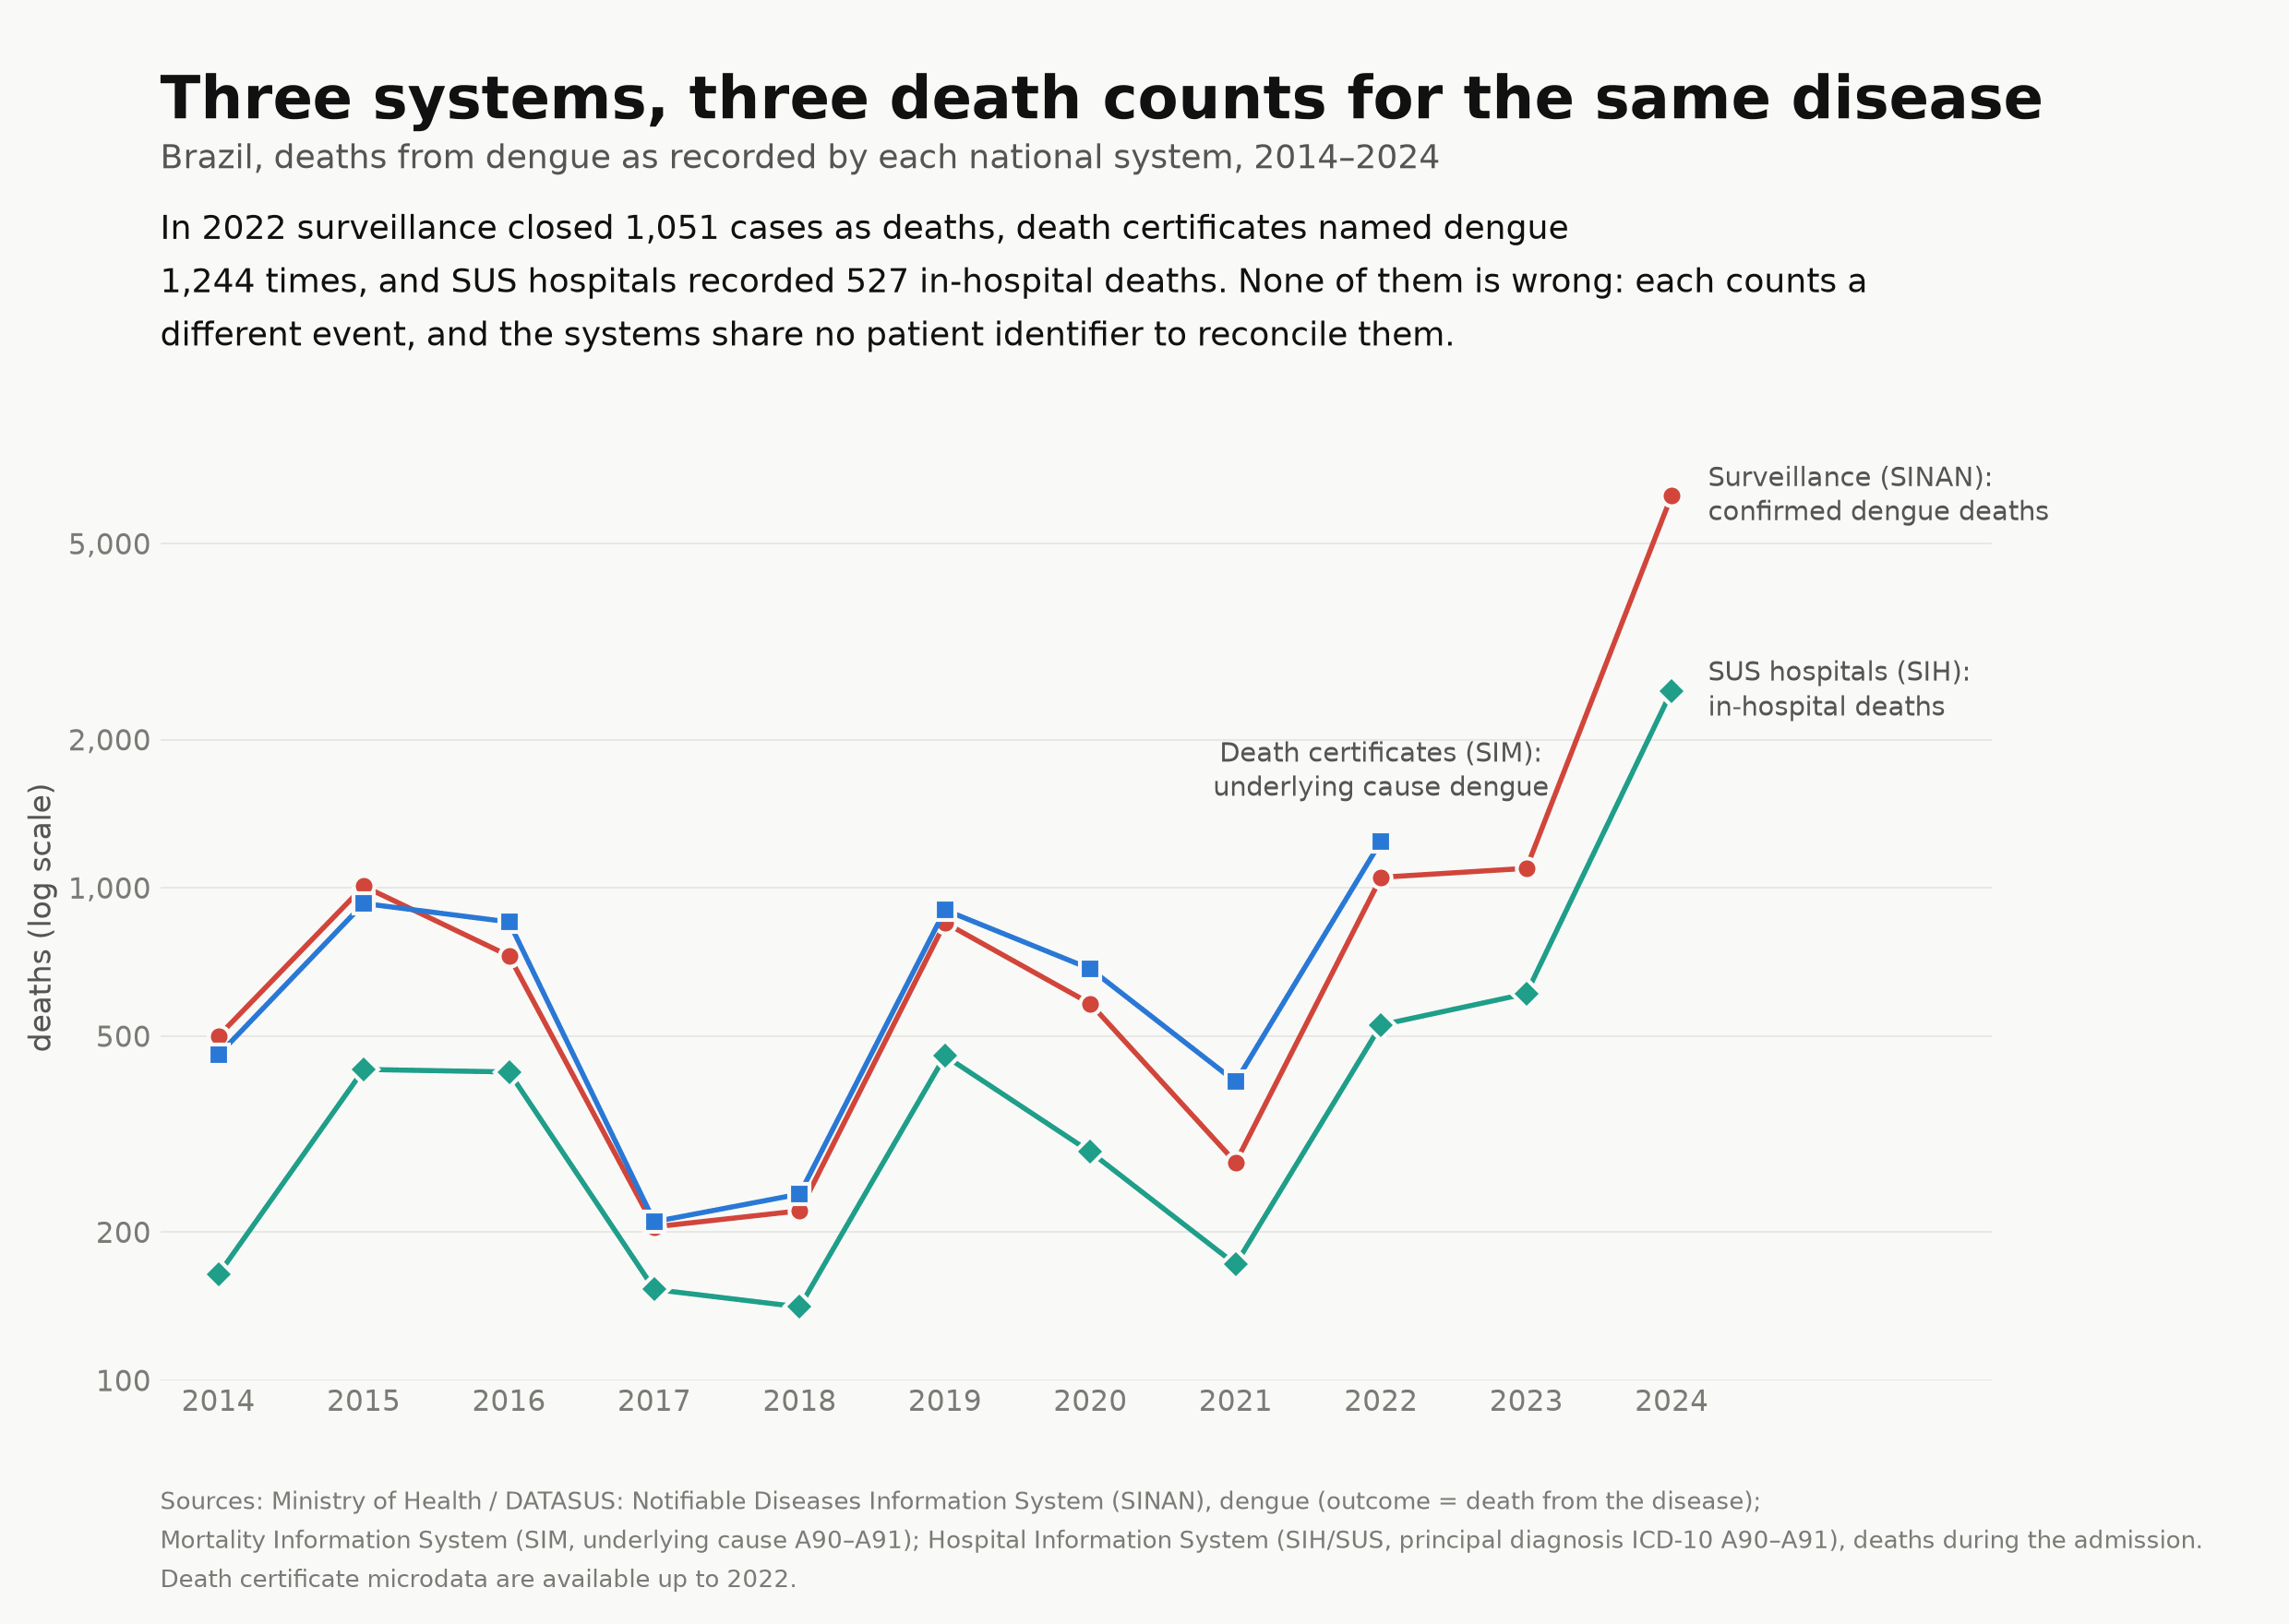
Three systems, three death counts. For 2014–2022, surveillance closed 5,422 cases as deaths, death certificates named dengue 5,925 times, and SUS hospitals recorded 2,755 in-hospital deaths. Each counts a different event, and without a patient identifier they cannot be reconciled one by one. A study that needs "dengue deaths" has to choose a definition and say which.
Within SINAN, which is record-level, risk factors can be read directly. In 2024 case fatality rose from 0.21 per 1,000 among children to 15.3 per 1,000 over age 80, and diabetic patients aged 60–79 died 2.9 times as often as non-diabetic ones of the same age. That comes with a caveat: comorbidity is recorded more carefully in severe cases.
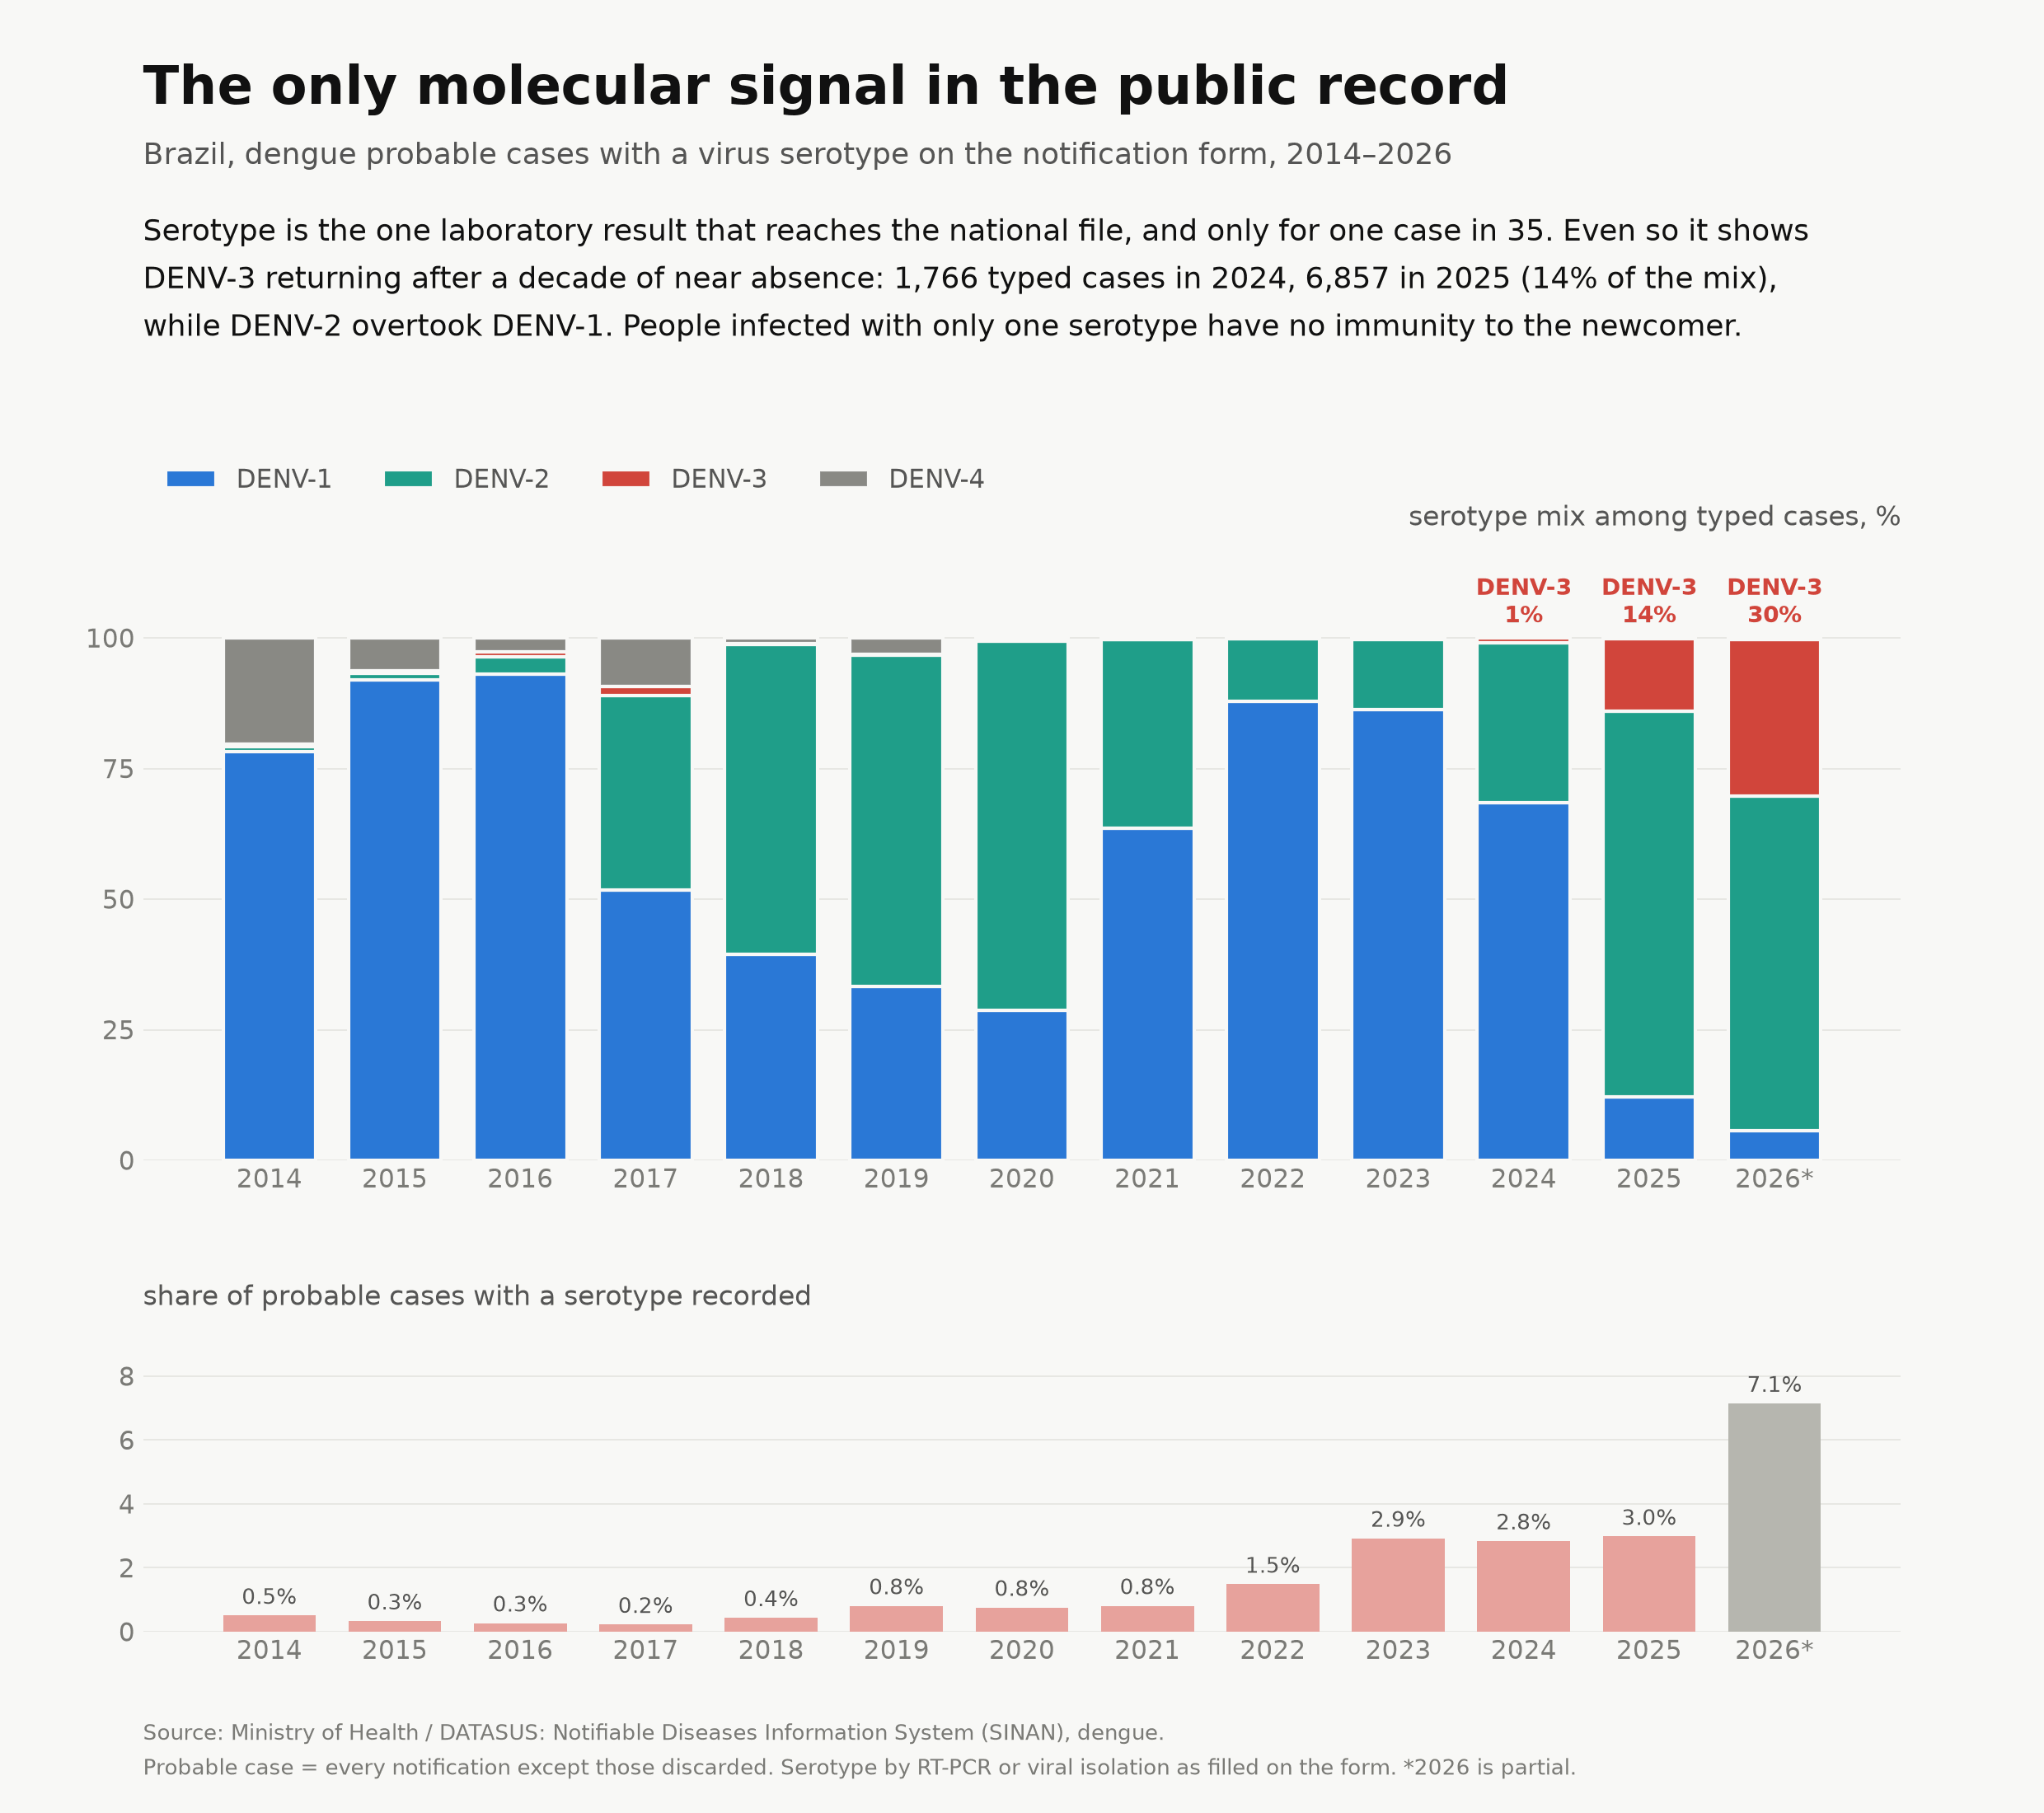
The notification form is also the only place where a molecular result reaches the national file: the virus serotype, from RT-PCR or viral isolation. It is filled for very few cases, 0.2–0.8% of probable cases a year until 2021 and about 3% since 2023. Even so, it is enough to see the virus change. DENV-3 was almost absent for a decade, with fewer than 110 typed cases a year until 2023. Then it rose to 1,766 in 2024 and 6,857 in 2025, 14% of typed cases, and to 30% in the partial 2026 file. Meanwhile DENV-2 overtook DENV-1, from 30% of the mix in 2024 to 74% in 2025. A population that met only DENV-1 and DENV-2 has no immunity to DENV-3. That matters for an epidemic forecast, or for choosing trial sites for a vaccine or an antiviral. It is a signal, though, not a sample: which cases get typed depends on the state laboratory, not on the patient.
Worked example 3: high-cost drugs, by disease
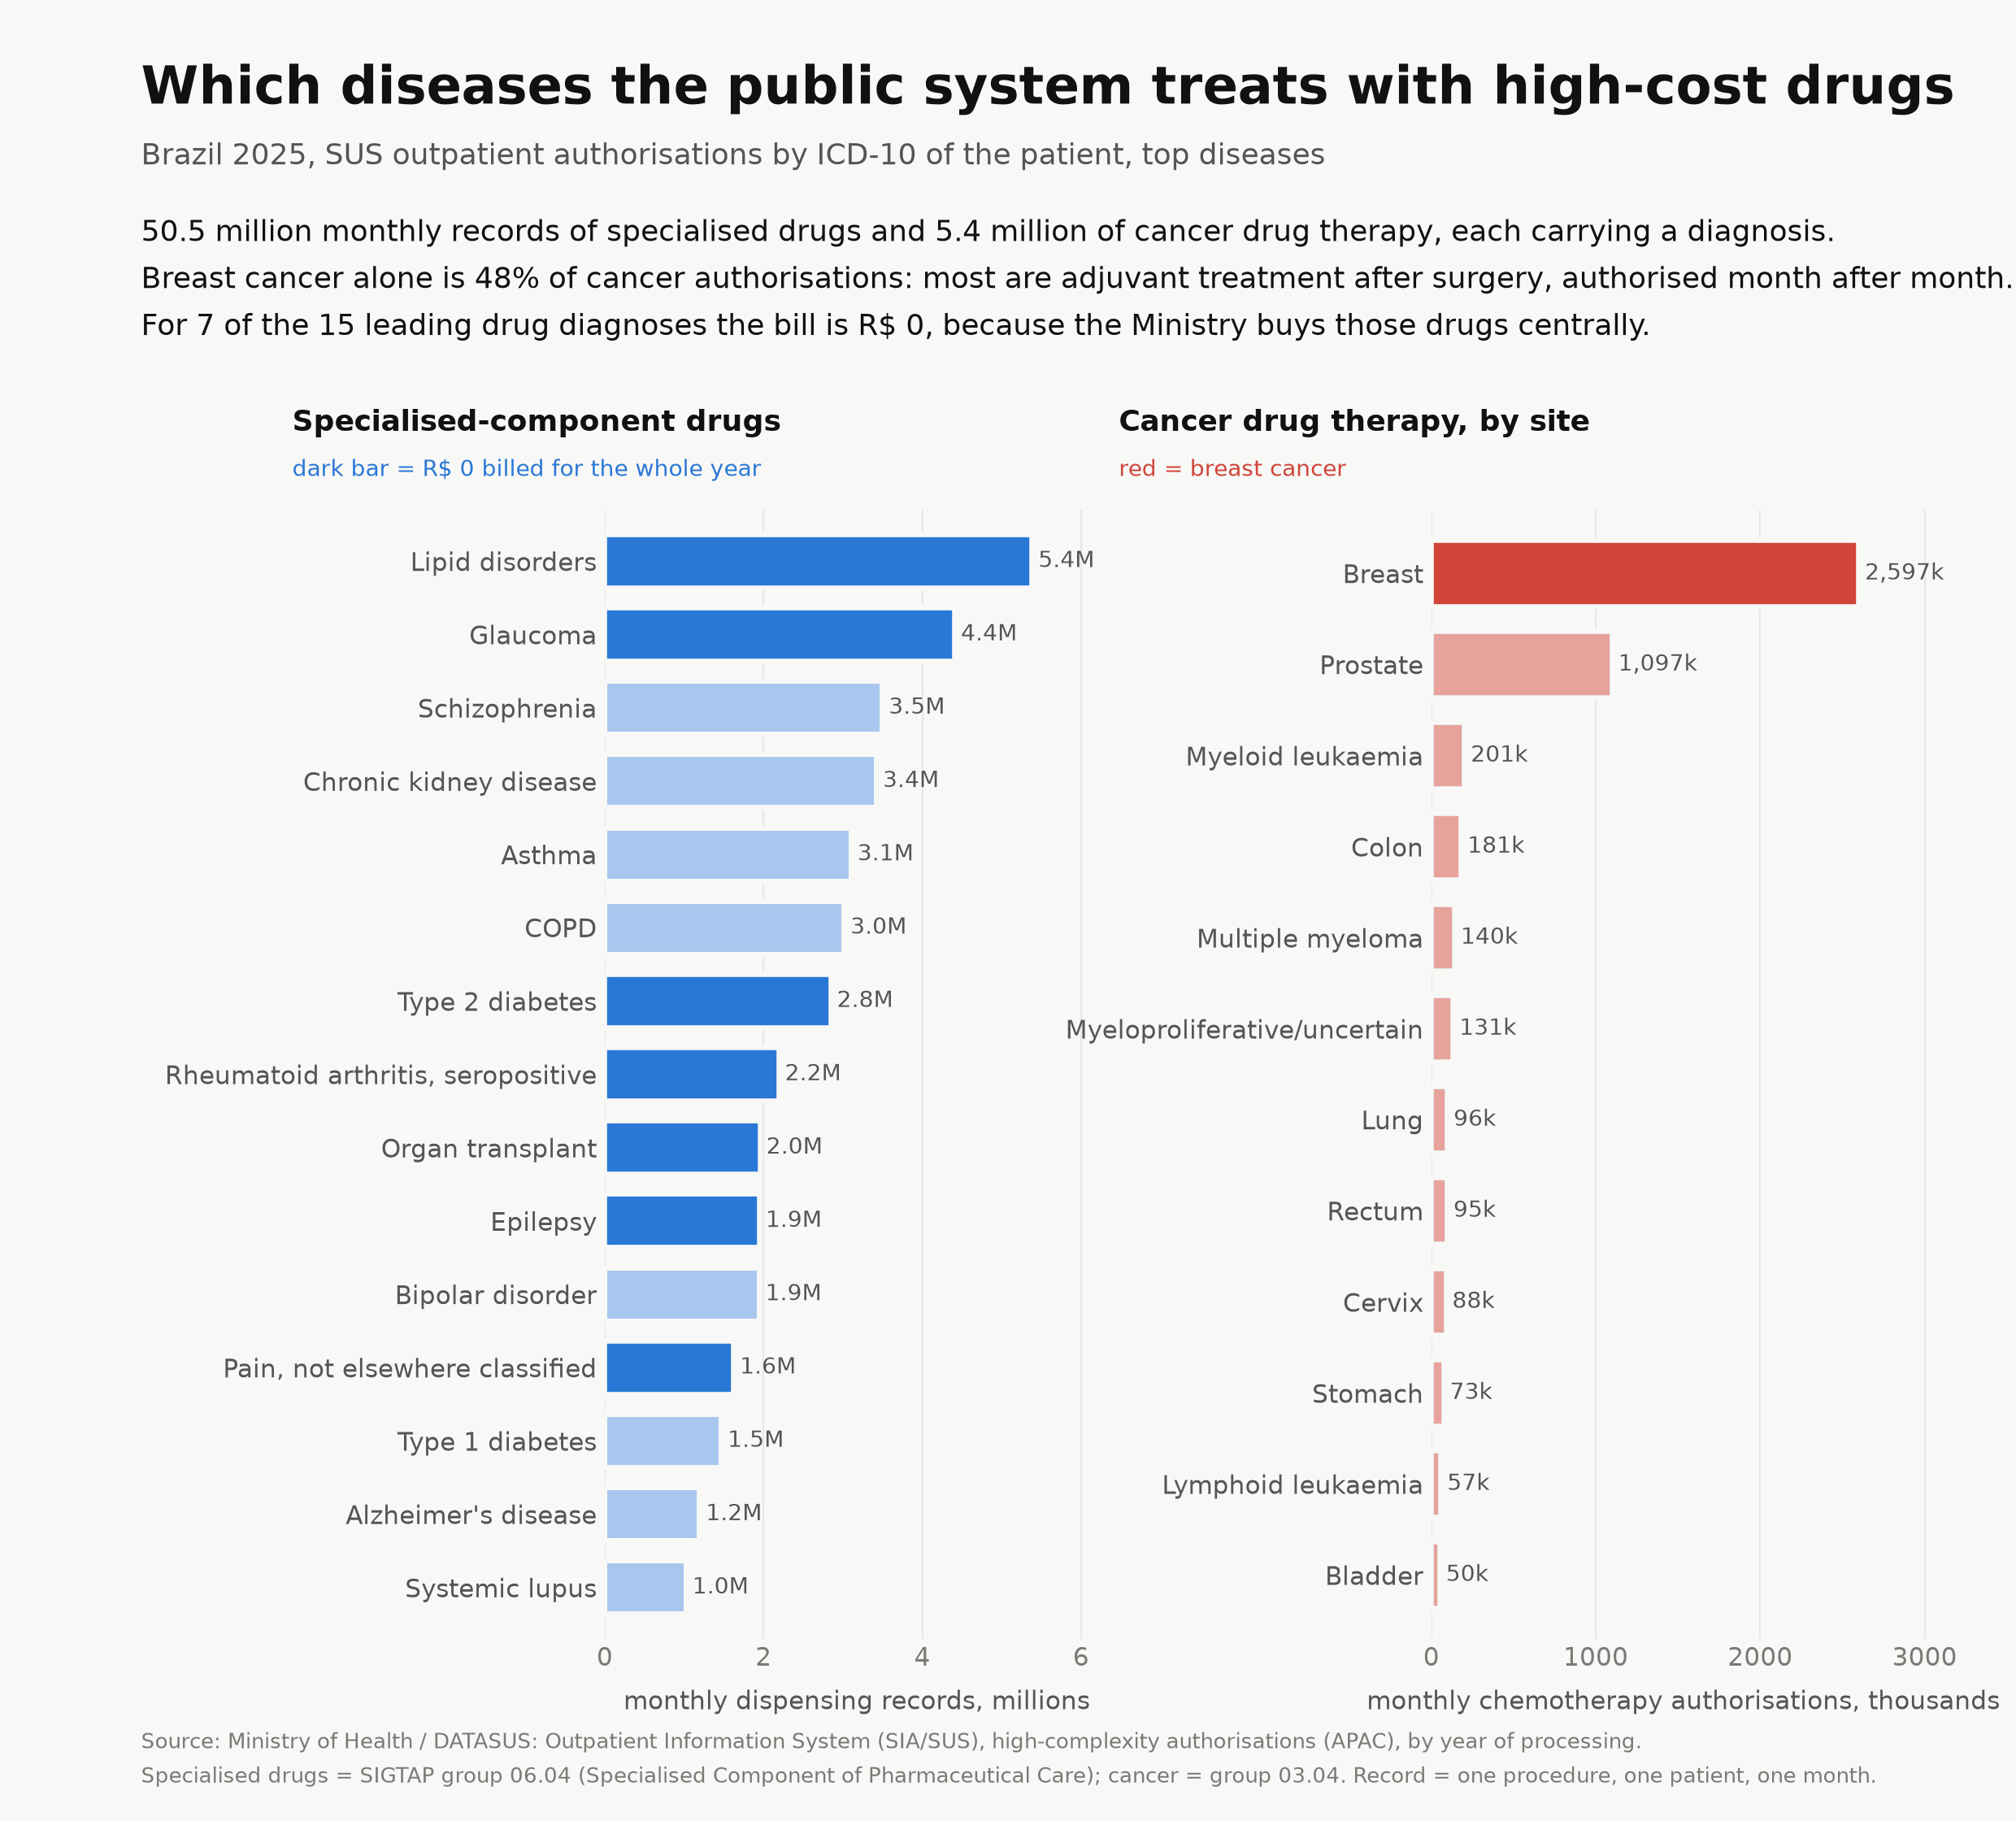
SUS dispenses high-cost medicines to outpatients through monthly authorisations (APAC). Each one names the procedure, which for drugs is the medicine, and the patient's diagnosis. In 2025 there were 50.5 million records from the Specialised Component of Pharmaceutical Care, the national programme for chronic and rare diseases. There were another 5.4 million for cancer drug therapy. Each record is one procedure for one patient in one month, so dividing by twelve gives a rough count of patients on treatment in an average month. Both files carry a diagnosis in every record, unlike the rest of outpatient billing. That makes this the closest public equivalent of a specialty-pharmacy claims file.
The diagnoses look like the treatment protocols. Lipid disorders, glaucoma, schizophrenia, chronic kidney disease, asthma and COPD lead by volume. Type 2 diabetes, rheumatoid arthritis, transplants and epilepsy follow. In cancer, breast tumours are 48% of all authorisations, most of them adjuvant therapy authorised month after month after surgery. Prostate cancer comes next, then myeloid leukaemia.
The amounts are the trap. For 7 of the 15 leading drug diagnoses, the bill for the whole year is R$ 0. The Ministry buys those medicines centrally and ships them to the states, so the authorisation records the dispensing but not the cost. In 2025 the authorisations billed R$ 2.03 billion. The federal budget line that buys these drugs spent R$ 12.85 billion in the same year. Between 2014 and 2020 the number of records rose by half while the billed amount fell by half. The authorisations measure how many patients get which treatment, where. They do not measure spending.
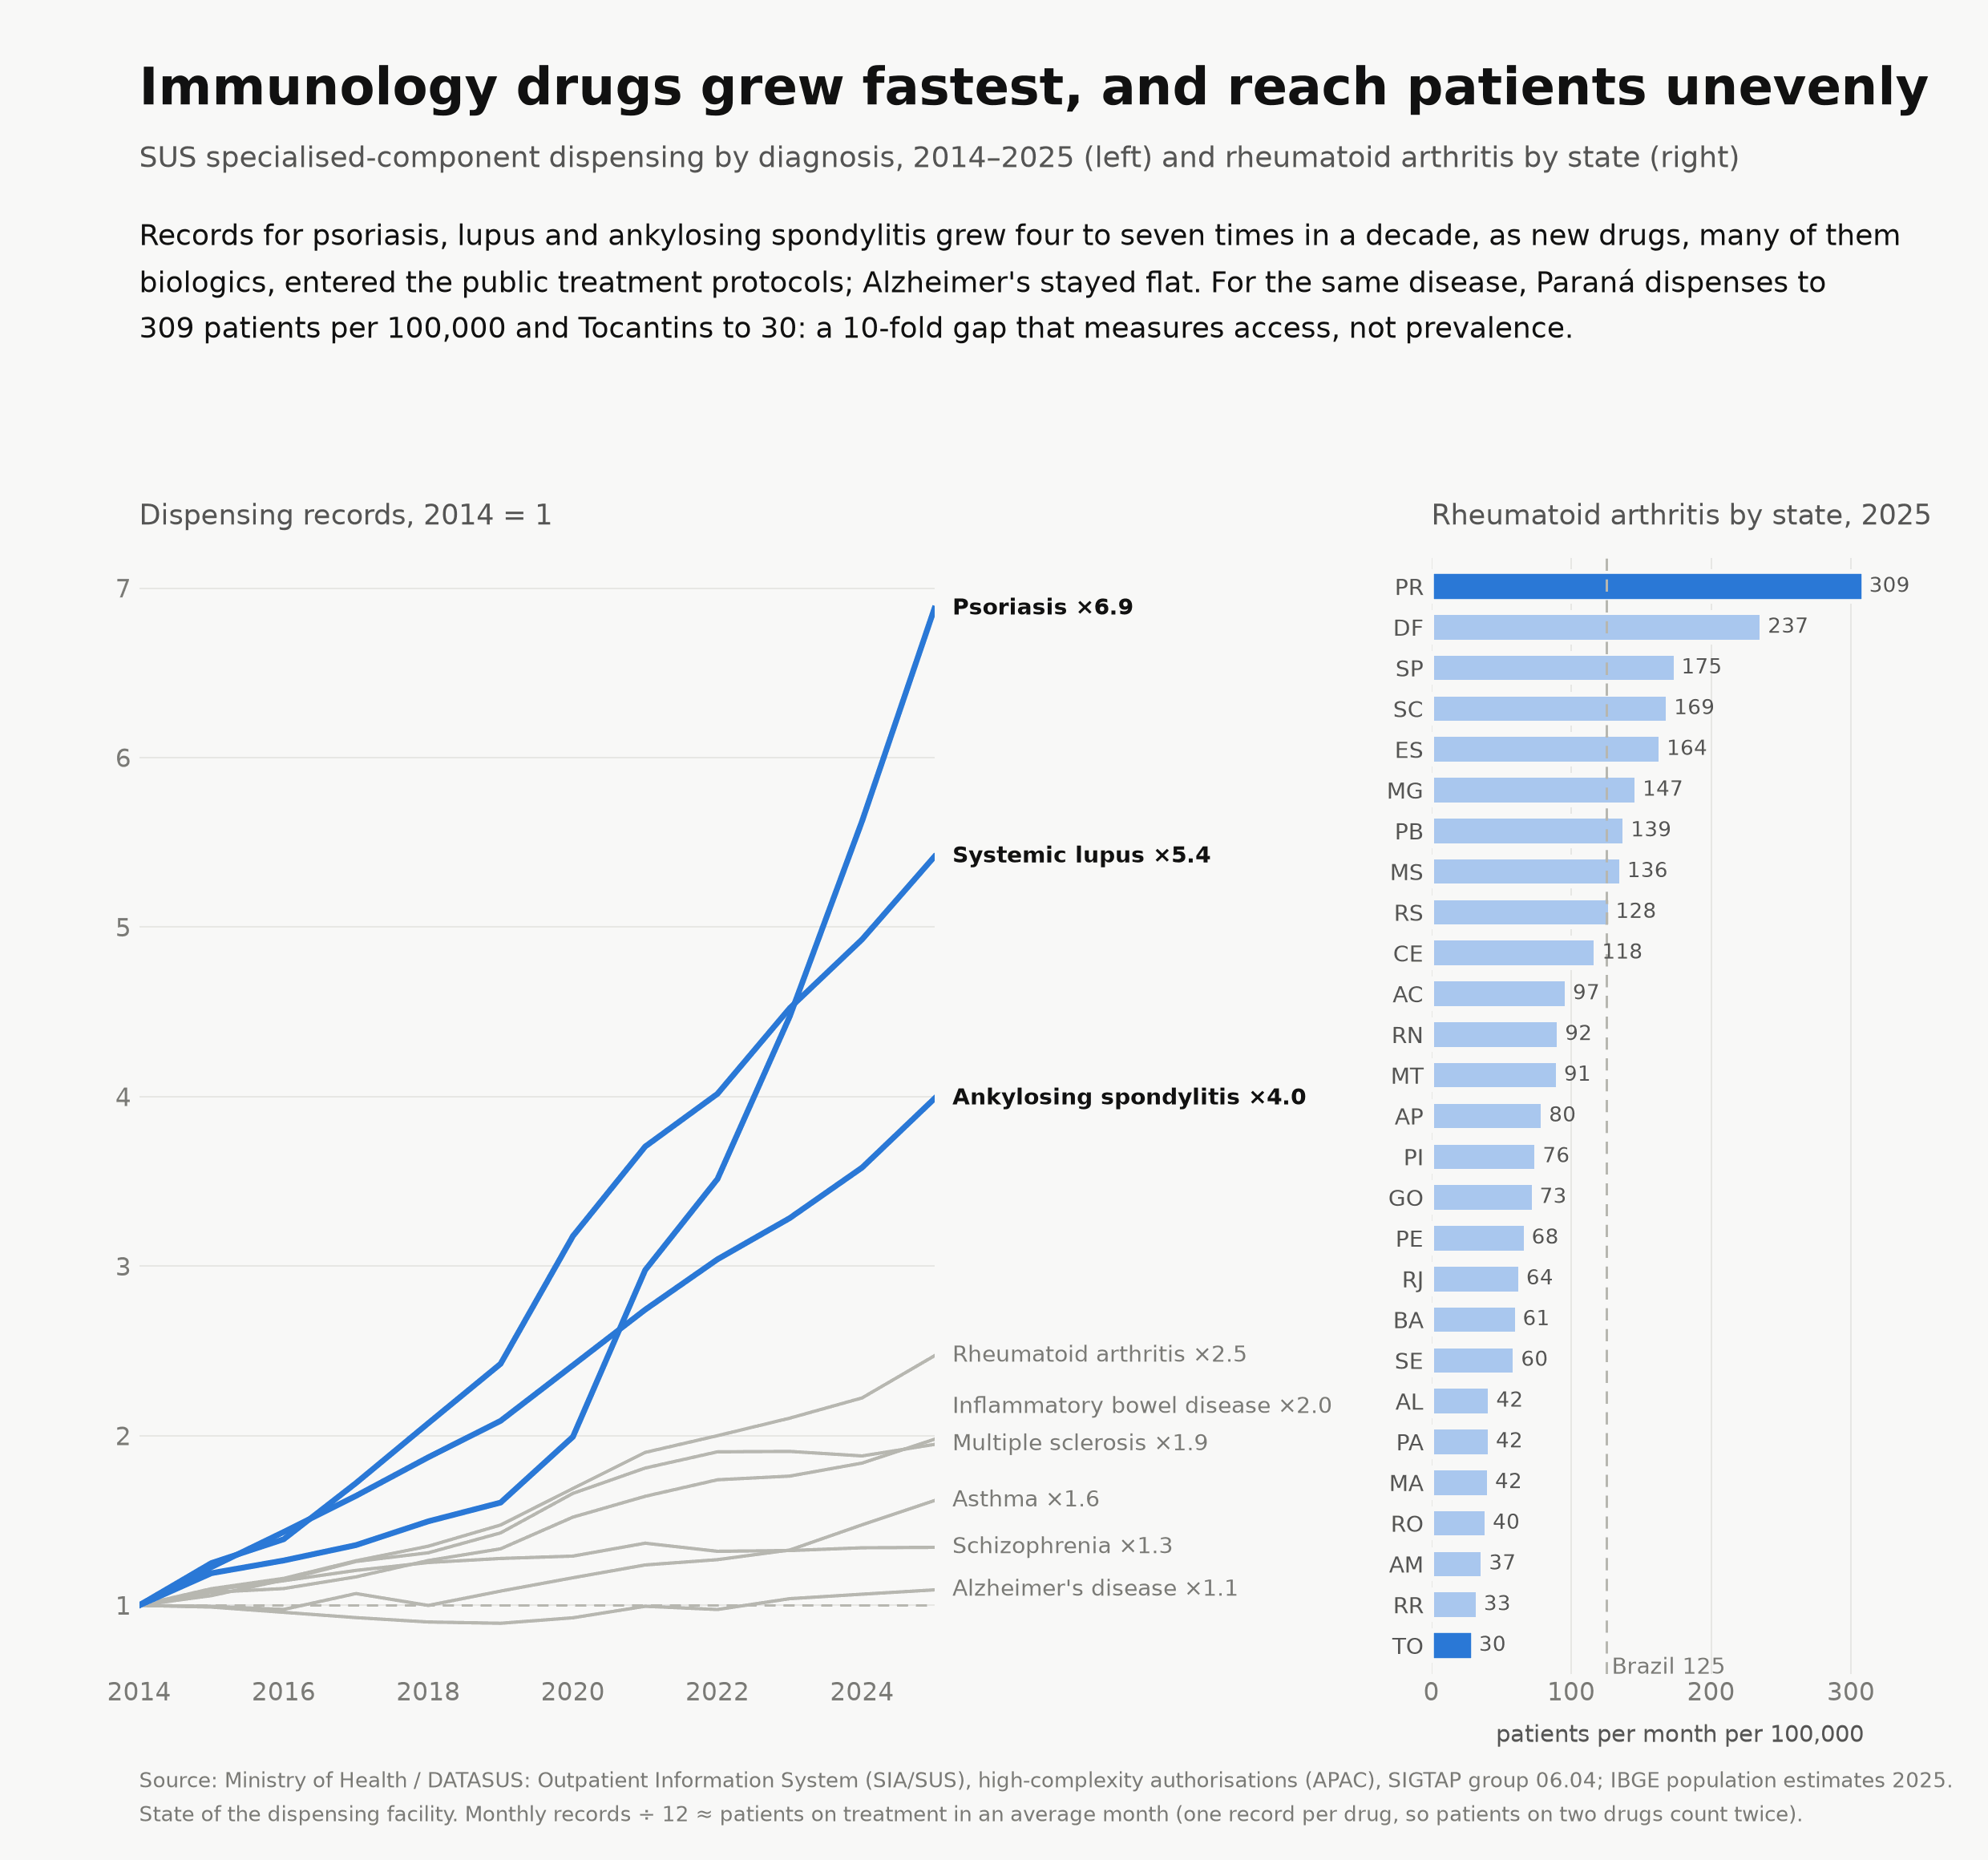
Over time they show uptake. Between 2014 and 2025, records for psoriasis grew 6.9 times, lupus 5.4 times and ankylosing spondylitis 4.0 times, as new medicines, many of them biologics, entered the public treatment protocols. Rheumatoid arthritis grew 2.5 times. Inflammatory bowel disease doubled and multiple sclerosis grew 1.9 times. Alzheimer's disease barely moved. Across states the same disease is treated at very different rates. Paraná dispenses rheumatoid arthritis drugs to 309 patients per 100,000 in an average month, the national figure is 125 and Tocantins is at 30. Rheumatoid arthritis prevalence does not vary 10-fold between Brazilian states, so most of that gap is access to diagnosis and to the programme. For a launch plan or a market-access case, that gap is the finding. The usual limits apply. Without a patient identifier, a patient on two drugs counts twice, switching between drugs is invisible, and persistence cannot be measured.
The gap also shows why lineage matters. A first run of this section used a secondary copy of the outpatient file. In it, Alagoas's specialised-drug records fell from 582,000 in 2023 to 221,000 in 2024, and the state appeared at 13 patients per 100,000, a 22-fold gap with Paraná. Rebuilt from the Ministry's original files, Alagoas has 632,000 records in 2025 and 42 patients per 100,000. The drop was missing data, not missing patients, and nothing in the copy flagged it.
What it can and can't answer
Good fit:
- Burden, trends and geography of hospitalised disease, deaths, births and notifiable diseases, nationally and down to the municipality.
- Health-care use and cost in the public system: admissions, length of stay, ICU use, outpatient high-cost procedures and drugs (APAC), amounts paid.
- Treatment uptake by disease and state for high-cost and cancer drugs dispensed by SUS.
- Ecological studies that join health outcomes to social and environmental data by municipality, which Brazil publishes for every municipality.
- Facility-level analyses of volume, capacity (beds, equipment, staff) and outcomes.
- Record-level risk factors within one system: age, sex, comorbidities and severity in surveillance; birth weight and gestational age in births.
Poor fit, or only with care:
- Anything that follows a patient across systems or over time: treatment sequences, persistence, time-to-event from diagnosis to death. This needs restricted access to identified data.
- Anything in the private sector, a quarter of the population, unevenly distributed.
- Outpatient diagnosis, which is mostly absent outside high-complexity procedures and high-cost drugs.
- Retail prescriptions and dispensing: what is public covers controlled drugs, and SUS high-cost drugs by diagnosis. The cost of centrally purchased drugs is not in the record.
- Anything molecular. Brazil publishes no genomic, transcriptomic or biomarker data alongside these systems. The one laboratory result in the national files is the dengue serotype, recorded for about 3% of cases.
- Comparisons across long periods without checking for coding and classification changes.
Method
Sources. Ministry of Health / DATASUS: SIH (reduced admission records and professional services), SIA (outpatient production and psychosocial care), SIM, SINASC, SINAN (dengue, chikungunya, zika, yellow fever, extra-Amazon malaria, severe acute respiratory infection, violence), SISVAN, SI-PNI, CNES. National Supplementary Health Agency (ANS). Anvisa (SNGPC). IBGE (population, municipality directory). Official ICD-10 table. SI-PNI read from a public third-party mirror of the official files.
Counts are records as published, by the year stored in each file. Rows are not people.
Completeness uses 2022 records; outpatient individual records (BPA-I, APAC, RAAS) and nutrition records use June 2022. A field counts as usable when it is not blank and not coded as unknown.
Linkage match rates compare each key with the official reference list: IBGE municipalities (7- or 6-digit), the CNES facility registry for the same year, and valid 3- and 4-character ICD-10 codes.
Ill-defined causes use the underlying cause of death; the state comes from the municipality-of-residence code, keeping deaths with a known state and unknown municipality. The 1996 national total (908,883 deaths) matches the official figure.
Private coverage counts active beneficiaries of medical-hospital plans in December, using only the latest data load for each month. The December 2022 total (50.0 million) is within 2% of the figure published by ANS.
Dengue probable cases are notifications not classified as discarded; admissions have principal diagnosis A90–A91; certificate deaths have underlying cause A90–A91.
High-cost drugs are outpatient authorisations (APAC, principal and secondary) in SIGTAP group 06.04, the Specialised Component of Pharmaceutical Care, and cancer drug therapy in group 03.04. They are counted by year of processing. 2025 and 2026 come from the Ministry's original monthly files; earlier years from a secondary copy, which for these two groups differs from the original by less than 2% where both exist (January–June 2025). 2026 is partial and left out. The diagnosis is the 3-character ICD-10 category, taken from whichever of the two diagnosis fields is filled. Rates by state use the state of the dispensing facility and IBGE population estimates for 2025. The federal reference is budget action 4705 (medicines of the Specialised Component), amount paid, from the federal budget execution data.
Serotype counts probable dengue cases whose form records DENV-1 to DENV-4. 2026 is partial.
Data run on 5 October 2026; the serotype paragraph and worked example 3 on 18 November 2026.